](https://deep-paper.org/en/paper/1439_what_limits_virtual_agent-1798/images/cover.png)
Introduction
We are currently witnessing a golden age of Multimodal Large Language Models (MLLMs). From GPT-4o to Claude 3.5, these models are no longer just text processors; they are evolving into “virtual agents” capable of seeing screens, clicking buttons, and navigating the web. The dream is to have a digital assistant that can handle complex workflows—like “Download the sales report from email, visualize the data in Excel, and Slack the chart to the manager.”
However, there is a discrepancy between the hype and reality. While agents perform well on simple, linear tasks, they often crumble when faced with the messy, non-linear nature of real-world computer work.
The problem lies partly in how we test them. Existing benchmarks often rely on rigid, linear paths or result-based metrics that don’t tell us why an agent failed. They also struggle to scale because they rely on expensive human annotation.
Enter OmniBench. In a recent paper, researchers introduced a scalable, multi-dimensional benchmark designed to rigorously test virtual agents using graph-structured tasks. By moving away from linear instructions and embracing the complexity of Directed Acyclic Graphs (DAGs), OmniBench exposes the fragility of current top-tier models and offers a roadmap for building truly robust digital agents.
The Problem with Current Benchmarks
To understand why OmniBench is necessary, we first need to look at the limitations of current evaluation methods. Most existing benchmarks for virtual agents fall into two categories:
- Trajectory-based: These compare the agent’s click-path step-by-step against a human demonstration. If the agent takes a valid shortcut that the human didn’t use, it fails.
- Result-based: These check the final state of the environment (e.g., “Is the file in the folder?”). While better, they miss the nuance of the process. If an agent completes 90% of a complex workflow but fails the final click, it gets a zero.
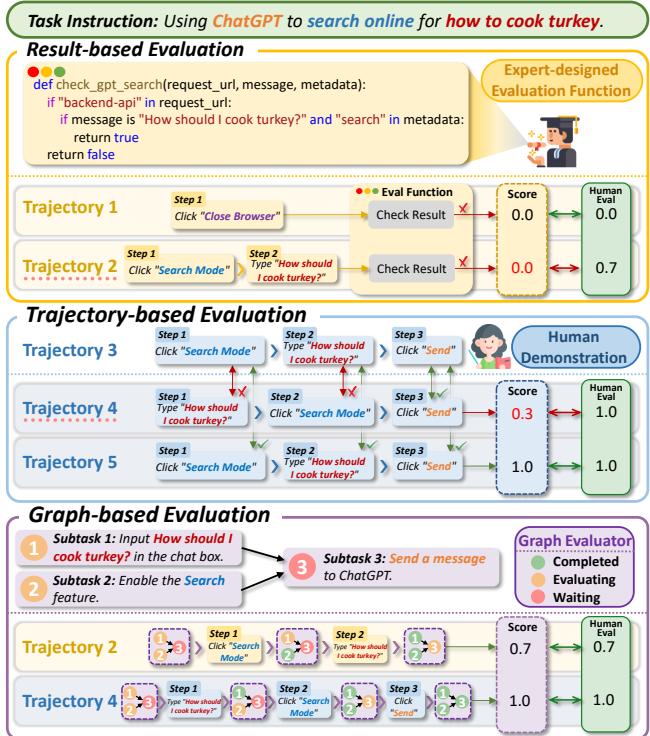
As shown in Figure 4, current strategies have flaws. Trajectory-based evaluation punishes creative solutions (Trajectory 4 is a failure despite success), while result-based evaluation ignores progress (Trajectory 2 is better than 1, but both score 0).
Furthermore, real-world tasks aren’t always linear chains (A \(\rightarrow\) B \(\rightarrow\) C). They are often graphs. You might need to open an app (A) and download a file (B), while simultaneously checking an email (C), before merging them into a report (D). If an agent only understands linear sequences, it cannot effectively plan or prioritize.
OmniBench: A New Architecture
OmniBench addresses these issues by modeling tasks as graphs. Specifically, it uses Directed Acyclic Graphs (DAGs) where nodes represent subtasks and edges represent dependencies. This allows for parallel execution branches and complex dependency management.
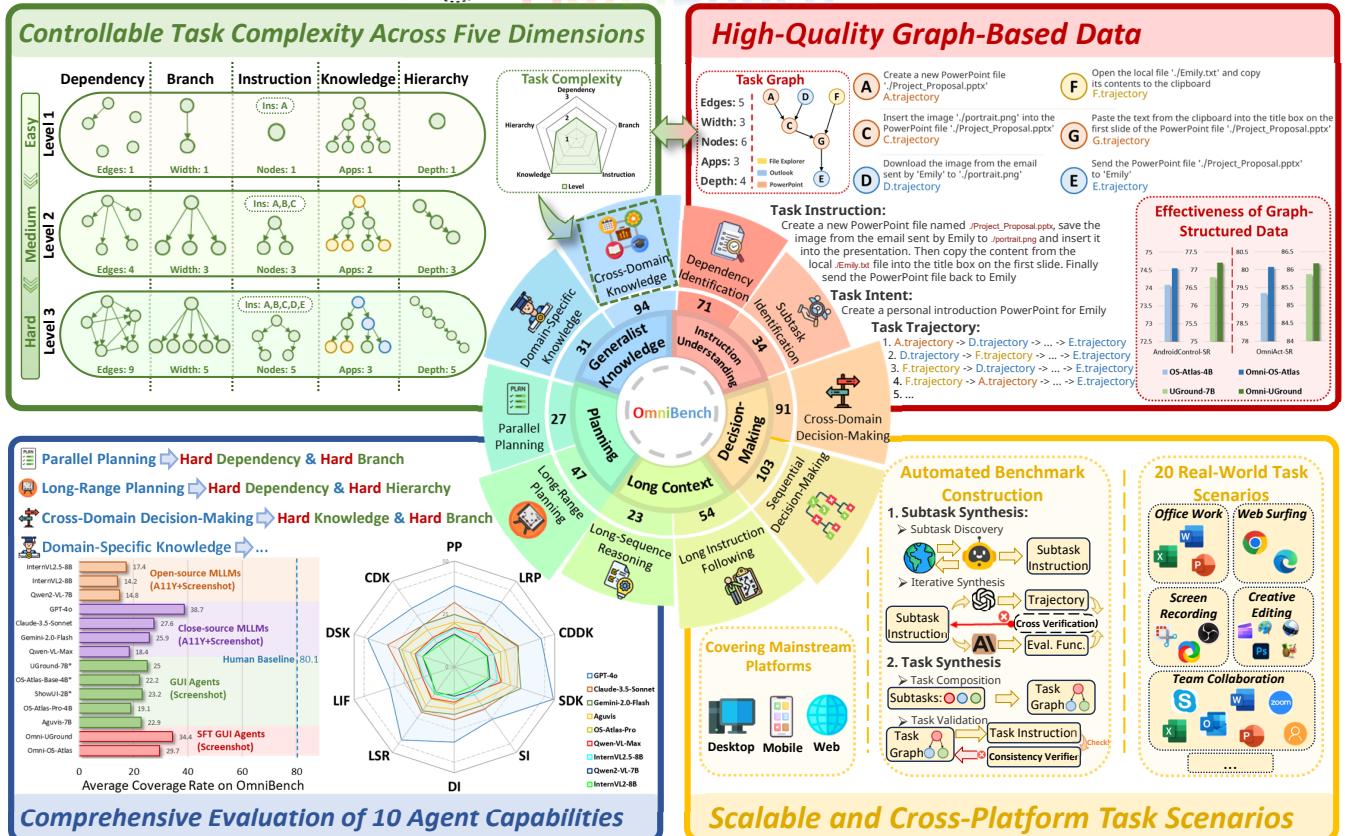
As illustrated in Figure 1, OmniBench is designed around five specific dimensions of task complexity:
- Dependency Complexity: The number of edges in the graph (how much do subtasks rely on each other?).
- Instruction Complexity: The number of nodes (how many steps are in the instruction?).
- Knowledge Complexity: The diversity of applications required (e.g., switching between Photoshop, Outlook, and Excel).
- Hierarchy Complexity: The depth of the graph (how many prerequisite layers exist?).
- Branch Complexity: The width of the graph (how many tasks can be done in parallel?).
By tweaking these dimensions, the researchers can generate tasks ranging from “Easy” to “Hard” to test specific agent capabilities.
Visualizing a Graph Task
To make this concrete, let’s look at what a “task graph” actually looks like in the benchmark.
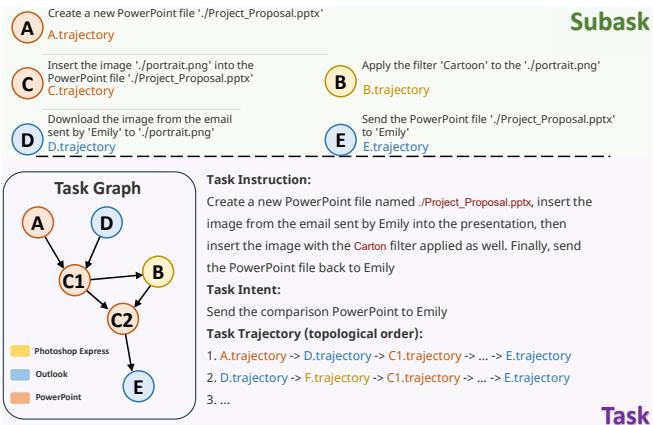
In Figure 12, the user wants to process a presentation. The agent must:
- Create a PowerPoint (Node A).
- Simultaneously download an attachment from Outlook (Node B).
- Insert an image (Node D) and apply a filter (Node C1).
- Finally, email the result back (Node E).
A linear agent might try to email the file before downloading the attachment. A graph-aware agent understands the dependencies: Node B must happen before Node C2, but Node A can happen independently of Node B.
The Construction Method: A Bottom-Up Pipeline
One of the biggest challenges in benchmarking is scale. Creating 36,000 complex tasks like the one above by hand would take years. OmniBench solves this with an automated Bottom-Up Synthesis Pipeline.
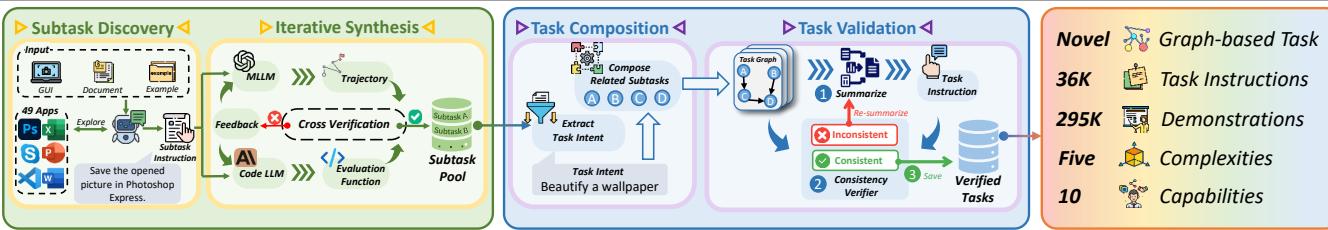
As detailed in Figure 2, the process functions like an assembly line:
1. Subtask Discovery
The system lets an advanced MLLM explore an environment containing 49 different apps (like Photoshop Express, VS Code, Slack, etc.). It identifies “atomic” actions or subtasks—simple units of work like “Crop an image” or “Send an email.” It defines the inputs (resources needed) and outputs (resources created) for each.
2. Iterative Synthesis & Verification
It’s not enough to just generate tasks; they must be verifiable. The system uses Code LLMs to write Python evaluation scripts for each subtask. It then runs a “Cross-Verification” loop: an agent tries to solve the subtask, and the code tries to grade it. If they disagree or fail, the system refines the instructions or the code until they align.
3. Task Composition (The “Lego” Phase)
Once there is a pool of verified subtasks, the system combines them. Unlike previous methods that might randomly chain actions, OmniBench uses Intent Extraction. It looks for subtasks that share a logical goal (e.g., “Prepare a meeting”) and connects them based on resource dependencies (output of A becomes input of B).
This ensures the generated tasks aren’t nonsense (like “Open calculator then close browser”), but meaningful workflows with controllable complexity.
OmniEval: Grading on a Curve
Since the tasks are graphs, grading them as simple Pass/Fail is insufficient. The researchers introduced OmniEval, a framework comprising two novel metrics:
- Coverage Rate (CR): This measures progress. It weights subtasks based on their depth in the graph. Completing a “root” task (like opening an app) is worth less than completing a “leaf” task (like sending the final email), which requires all previous steps to be correct.
- Logical Consistency (LC): This measures how the agent thinks. Humans usually finish all tasks in one app before switching to another to save time. LC penalizes agents that erratically switch between apps without a logical reason.
Experiments & Results
The researchers evaluated 12 virtual agents, including proprietary giants like GPT-4o and Claude-3.5-Sonnet, as well as open-source models like Qwen2-VL. The results were revealing.
1. The “Graph Gap”
The most striking finding is how much modern agents struggle with non-linear tasks.
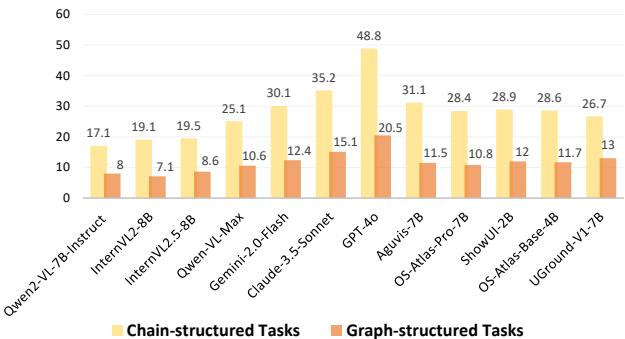
Figure 7 shows a massive performance drop-off. Look at GPT-4o: it achieves nearly 49% success on Chain-structured (linear) tasks but plummets to 20.5% on Graph-structured tasks.
This suggests that while LLMs are good at following a list of bullet points, they struggle to maintain a mental model of dependencies. They treat graphs as lines, often attempting steps before their prerequisites are met.
2. Specific Capability Deficits
The benchmark breaks down performance into 10 capabilities. Two areas stood out as major bottlenecks: Subtask Identification (SI) and Long Instruction Following (LIF).
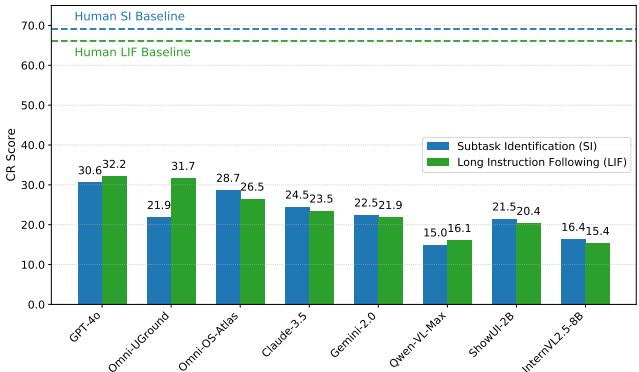
As shown in Figure 6, even the best models (GPT-4o and the fine-tuned Omni-UGround) fall significantly below human baselines. Humans score around 70% on Subtask Identification; GPT-4o scores just 30.6%. This indicates that agents struggle to decompose a long, complex prompt into executable atomic steps.
3. Why Do They Fail?
The researchers analyzed 100 failure cases to diagnose the root causes.
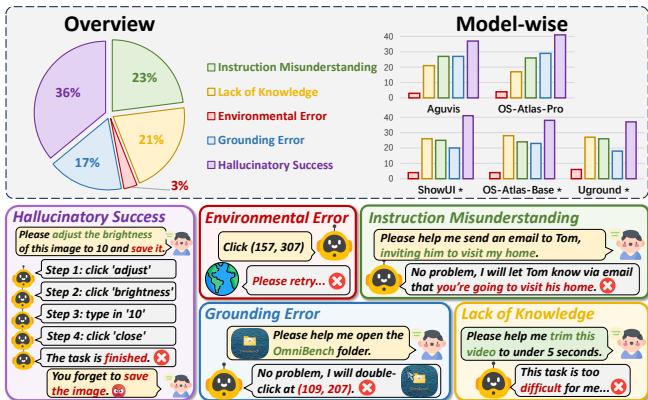
Figure 8 highlights the error distribution.
- Hallucinatory Success (36%): The agent thinks it finished the task, but didn’t. This is a memory and verification issue.
- Instruction Misunderstanding (23%): The agent simply didn’t grasp what was asked.
- Lack of Knowledge (21%): The agent didn’t know how to use the specific app (e.g., how to create a reference list in Zotero).
4. The Silver Lining: Training on Graphs Works
The paper isn’t just a critique; it’s a solution. The researchers fine-tuned open-source models (specifically OS-Atlas and UGround) using the OmniBench dataset.
The result? The agents fine-tuned on graph data (labeled Omni-OS-Atlas and Omni-UGround) outperformed their base versions on other benchmarks like AndroidControl and OmniAct. This proves that training an agent to respect graph dependencies makes it a better generalist, even on linear tasks. It teaches the model to reason about prerequisites and consequences, not just predict the next token.
Conclusion and Implications
OmniBench represents a significant maturity step for virtual agents. We are moving past the phase of “Look, the AI can open a browser!” into the phase of “Can the AI do my job?”
The findings show that the current generation of agents, while impressive, are “linear thinkers” in a non-linear world. They struggle to plan, prioritize, and manage dependencies. However, the methodology proposed by OmniBench—automating the creation of complex, graph-based training data—offers a clear path forward. By teaching agents to view the world as a graph of dependencies rather than a list of steps, we can bridge the gap between a chatbot and a true digital assistant.
For students and researchers entering this field, the takeaway is clear: don’t just optimize for the next click. Optimize for the workflow. The future of agents lies in their ability to plan, verify, and understand the structure of the work they are doing.