](https://deep-paper.org/en/paper/2305.14341/images/cover.png)
Science has a communication problem. While researchers are making breakthroughs at an unprecedented pace, the resulting papers are often dense, jargon-filled, and inaccessible to the general public. This gap has given rise to the task of Plain Language Summarization (PLS)—rewriting complex scientific abstracts into clear, accessible language that a non-expert can understand.
With the rise of Large Language Models (LLMs), automating this process seems within reach. But there is a catch: How do we know if a summary is actually "plain"?
Standard metrics used in Natural Language Processing (NLP) like ROUGE or BLEU were designed to match word overlaps, not to measure how easy a text is to read or whether it explains technical terms correctly. To solve this, a team of researchers from the University of Illinois Urbana-Champaign, University of Arizona, University of Washington, and the Allen Institute for AI developed APPLS.
In this post, we will dive deep into their paper, exploring how they built a “meta-evaluation” testbed to grade the graders, and what their findings tell us about the future of AI text evaluation.
The Problem: When Metrics Miss the Point
To understand why we need APPLS, we first need to look at how we currently grade AI summaries.
Traditionally, if you want to see if an AI model is good at summarizing, you compare its output to a “gold standard” written by a human. Metrics like ROUGE (Recall-Oriented Understudy for Gisting Evaluation) simply count how many n-grams (sequences of words) overlap between the AI’s text and the human’s text.
However, Plain Language Summarization is multifaceted. It involves:
- Simplification: Replacing complex words with simple ones.
- Explanation: Adding background info (like definitions).
- Jargon Removal: Cutting out unnecessary technical details.
An AI might write a summary that is perfectly accurate and very simple, but if it uses different words than the human reference, ROUGE will give it a low score. Conversely, an AI might copy the complex abstract verbatim. ROUGE might give it a high score for overlap, even though the AI failed to simplify anything.
The researchers realized that to advance the field, we need metrics that are sensitive to the specific nuances of PLS.
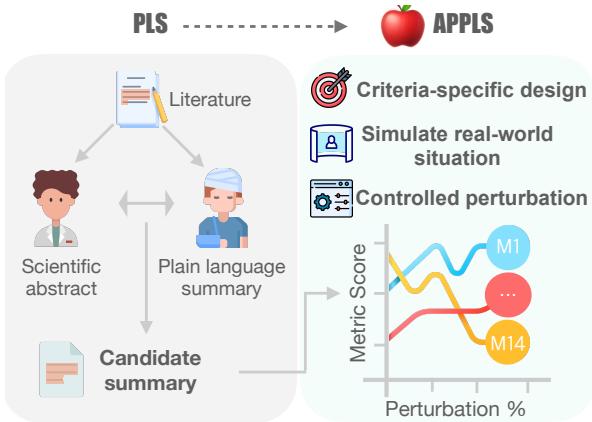
The APPLS Methodology: A Testbed for Metrics
The researchers introduced APPLS, a granular meta-evaluation testbed. The goal wasn’t to evaluate a summarization model, but to evaluate the evaluation metrics themselves.
To do this, they identified four critical criteria that a good PLS metric must capture:
- Informativeness: Does the summary cover the main findings and methods?
- Simplification: Is the language accessible to a lay audience?
- Coherence: does the text flow logically?
- Faithfulness: Is the summary factually accurate compared to the source?
Constructing the “Apples”
You cannot test a metric if you don’t know the ground truth quality of the text it is measuring. The researchers needed a controlled environment where they knew exactly what was wrong with a summary to see if the metrics could catch it.
They started with the CELLS dataset, a collection of scientific papers paired with plain language summaries.
To create their testbed, they followed a clever pipeline shown in the figure below:
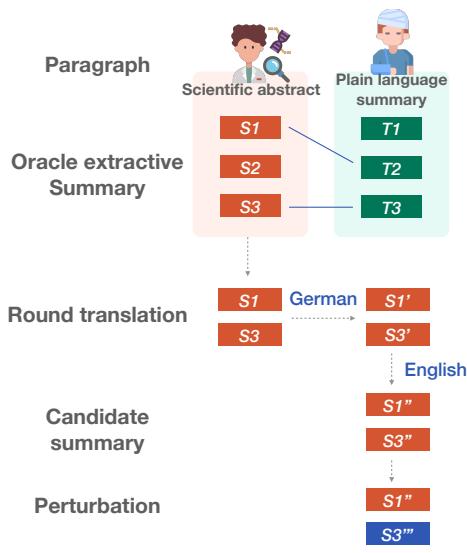
- Extraction: They extracted the most relevant sentences from the scientific abstract.
- Round-Trip Translation (RTT): To create a natural-sounding “Candidate Summary” that wasn’t just a direct copy, they translated the English text to German and back to English. This introduced lexical variation while keeping the meaning intact.
- Perturbation: This is the core innovation. They systematically “broke” these candidate summaries using 11 different types of errors (perturbations) across the four criteria.
The Perturbations
The researchers applied specific changes (perturbations) to the text and checked if the metrics reacted appropriately. If a metric is good at measuring Coherence, its score should drop as you shuffle the sentences. If it measures Faithfulness, it should tank when you swap the numbers.
Here is how they broke the text:
- Informativeness: They deleted sentences or added irrelevant sentences (hallucinations) from other domains.
- Simplification: They used GPT-4 to simplify the text. A metric sensitive to simplification should see its score change as the text gets simpler.
- Coherence: They randomly reordered the sentences.
- Faithfulness: They introduced subtle but dangerous errors:
- Number Swap: Changing “59 million” to “64 million.”
- Entity Swap: Replacing a specific virus name with a different one.
- Verb Swap: Changing “infected” to “saved” (antonym swap).
Results: How Did the Metrics Perform?
The researchers tested 14 metrics, including standard overlaps (ROUGE, BLEU), model-based metrics (BERTScore), text simplification metrics (SARI), and even LLM-based evaluation (asking GPT-4 to grade the text).
The results, visualized below, reveal a messy landscape where no single metric wins at everything.
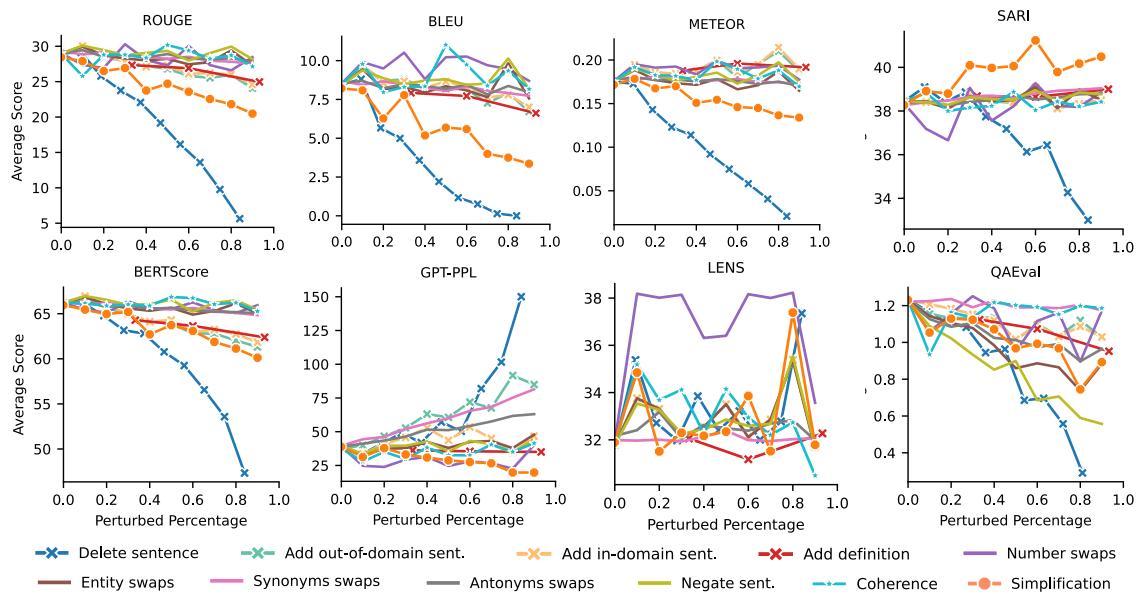
1. The Simplification Blind Spot
The most striking finding is how poorly standard metrics handle simplification.
Look at the SARI line in the graph above (the only one trending upward in the Simplification category). SARI is a metric explicitly designed for text simplification. It rewards the model for keeping good words, deleting bad words, and adding new simple words. It was the only automated metric that consistently improved as the text became simpler.
In contrast, look at ROUGE, BLEU, and BERTScore. As the text became more simplified (and objectively better for a lay audience), these scores decreased. Because the simplified text looked less like the original complex reference, these metrics penalized it.
The researchers proved this with a “swap” experiment. They calculated scores going from complex-to-simple and simple-to-complex. A good simplification metric should react differently to these two directions.
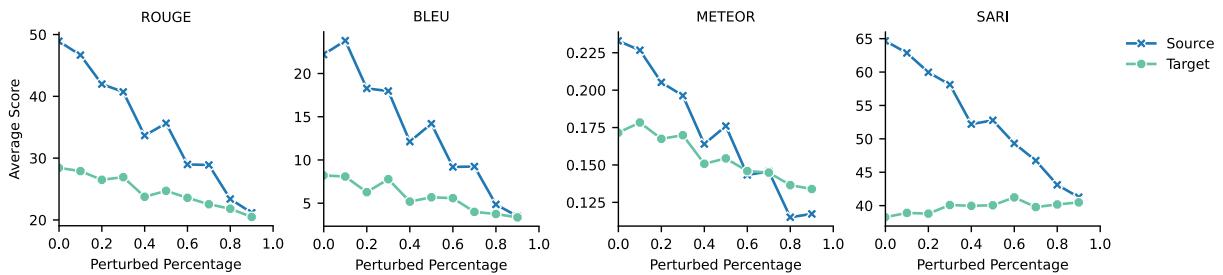
As shown in Figure 13, ROUGE and BLEU dropped regardless of the direction. They simply measure similarity, not simplicity. This confirms that standard summarization metrics are fundamentally unsuited for measuring how “plain” a summary is.
2. Lexical Features: A Reliable Signal
If complex metrics fail, what about simple statistics? The researchers looked at lexical features—counting verbs, nouns, sentence length, and word rarity.
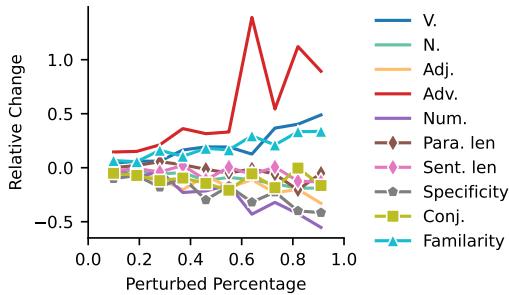
The results were consistent with linguistic theory:
- Sentence Length (Sent.len) decreased as simplification increased.
- Adverbs (Adv.) and Verbs (V.) increased.
- Nouns (N.) and Specificity decreased.
Interestingly, Conjunctions (words like “therefore” or “however”) decreased. While some literature suggests conjunctions help flow, in PLS, shorter sentences often mean chopping up complex compound sentences, leading to fewer conjunctions. These simple features turned out to be robust indicators of simplicity.
3. Can LLMs Grade Themselves?
Finally, the team investigated “LLM-as-a-Judge.” They fed the summaries to GPT-4 with a prompt defining the four criteria and asked it to score the text from 0 to 100.
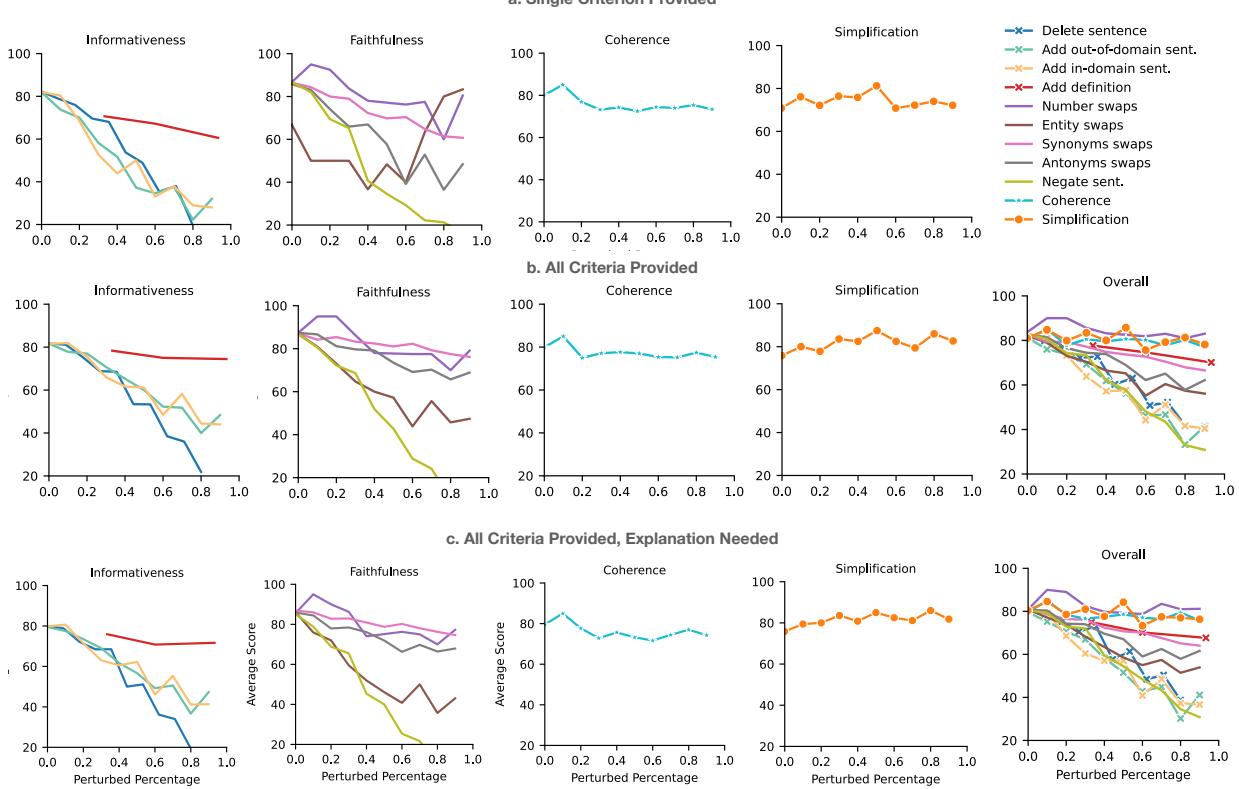
The results (Figure 4) were promising but mixed:
- Strengths: GPT-4 was sensitive to Informativeness (detecting deleted sentences) and Faithfulness (noticing hallucinations). It also tracked Simplification reasonably well.
- Weaknesses: It struggled with Coherence. Even when sentences were shuffled significantly, the LLM scores didn’t drop as sharply as expected.
The researchers also found that asking the LLM for an explanation alongside the score didn’t significantly improve the correlation. However, providing all criteria in a single prompt (setting ‘b’ in the chart) was generally more efficient and effective than asking for them one by one.
Conclusion and Recommendations
The creation of APPLS provides the first comprehensive “stress test” for PLS evaluation. The takeaway for students and researchers is clear: Do not rely on a single score.
If you are building a system to summarize science for the public:
- Use SARI to measure simplicity. It is the only automated metric that actually understands the task.
- Use QAEval or LLM-based scoring to check for Faithfulness. You cannot afford for a medical summary to be hallucinated.
- Use Lexical Features (like sentence length and common word percentage) as a sanity check for readability.
- Avoid ROUGE/BLEU for measuring simplification quality. They are fine for checking content overlap, but they will punish your model for using simpler vocabulary.
The APPLS framework demonstrates that evaluating generation is just as hard as the generation itself. By using controlled perturbations—breaking things on purpose—we can better understand what our metrics are actually seeing, ensuring that when we say a summary is “plain language,” we really mean it.