](https://deep-paper.org/en/paper/2403.02281/images/cover.png)
Introduction: The “Affective Soup”
Imagine you are having a terrible day. When a friend asks you how you are feeling, what do you say? Do you reply that you are “frustrated” because a project stalled, “anxious” about an upcoming deadline, and “disappointed” in a colleague? Or do you simply say you feel “bad” or “stressed”?
This distinction—the ability to identify and label emotions with specificity—is what psychologists call Emotion Granularity (EG).
People with high emotion granularity are emotional experts. They experience the world in high definition, distinguishing clearly between distinct feelings like anger, sadness, and fear. Conversely, individuals with low emotion granularity experience emotions as a blur—a sort of “affective soup” where negative feelings are lumped together into a general sense of unpleasantness.
Why does this matter? For decades, psychology research has shown that high emotion granularity is a superpower for mental health. If you know exactly what you are feeling, you know how to regulate it. You treat “sadness” with self-care, and “anger” with conflict resolution. If you only feel “bad,” you might resort to maladaptive coping mechanisms like substance abuse or aggression.
Until now, measuring emotion granularity required tedious “experience sampling” methods—asking people to fill out surveys multiple times a day for weeks. But what if we could measure this psychological trait just by looking at the words we type online?
In the research paper “Emotion Granularity from Text: An Aggregate-Level Indicator of Mental Health,” researchers from the University of Toronto, Vector Institute, and UNC Chapel Hill propose a novel computational method to do just that. They analyze social media timelines to see if the “resolution” of our emotional language can serve as an indicator for mental health conditions.
Background: From Psychology to Natural Language Processing
Before diving into the algorithms, we need to understand the psychological foundation. In affective science, granularity is typically measured by asking people to rate the intensity of various emotions (e.g., anger, fear, happiness) repeatedly over time.
If a person consistently rates “anger” and “sadness” at the same intensity levels every time they are asked, they are essentially treating these words as synonyms. Their granularity is low. If the ratings for “anger” and “sadness” vary independently—meaning they sometimes feel angry without being sad, and vice versa—their granularity is high.
Historically, Natural Language Processing (NLP) in mental health has focused on sentiment analysis (is this text positive or negative?) or prevalence (how often does this person say “sad”?). While useful, these metrics miss the structural relationship between emotions.
The researchers behind this paper argue that it’s not just about how much sadness you express, but how distinct that sadness is from other negative emotions. They hypothesize that we can approximate emotion granularity by analyzing the temporal sequence of a user’s social media posts.
The Data: Mining Mental Health on Social Media
To test this hypothesis, the authors needed a massive dataset of individuals with known mental health conditions (MHCs) and a control group for comparison. They utilized two primary datasets:
- Twitter-STMHD: A dataset identifying users who self-disclosed diagnoses (e.g., “I was diagnosed with Bipolar Disorder”) using strict regular expressions and manual verification.
- Reddit eRisk: A dataset of users who self-disclosed depression, collected for early risk prediction tasks.
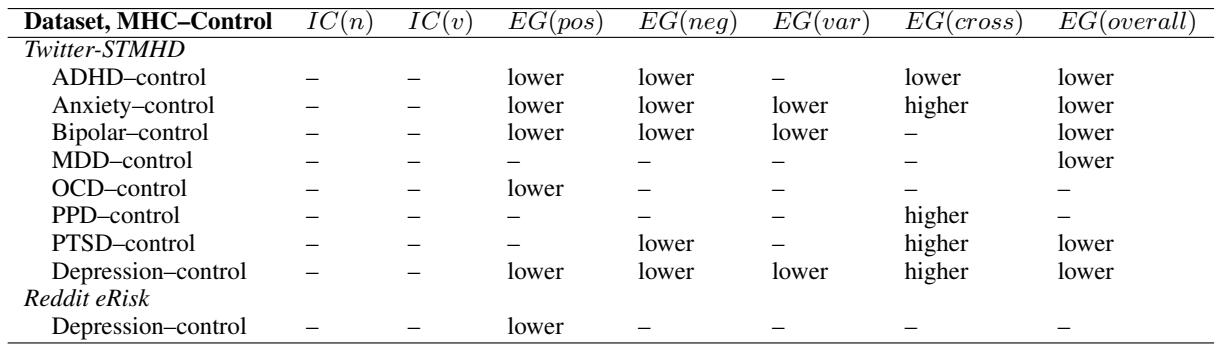
The scope of the data is significant. As shown in Table 1 below, the study covers nearly 20,000 users in the Mental Health Condition (MHC) group across diagnoses including ADHD, Anxiety, Bipolar Disorder, Major Depressive Disorder (MDD), OCD, Postpartum Depression (PPD), and PTSD.
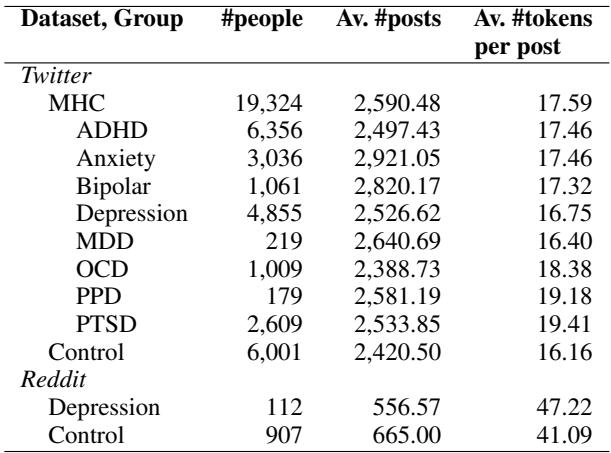
The researchers applied rigorous preprocessing. They filtered out retweets to focus on original content, removed posts with URLs (which often lack context), and excluded users with too few posts to form a reliable timeline. This ensured that the analysis focused on the genuine, longitudinal voice of the individual.
Methodology: Constructing Emotion Arcs
This is the core innovation of the paper. How do you translate a series of tweets into a mathematical score for “Emotional Granularity”? The process involves three main stages: Emotion Scoring, Arc Construction, and Granularity Calculation.
1. Emotion Scoring with Lexicons
The researchers used the NRC Emotion Intensity Lexicon, which associates roughly 10,000 English words with real-valued scores (0 to 1) for eight emotions: anger, anticipation, disgust, fear, joy, sadness, surprise, and trust.
However, social media language is unique. A word like “shook” might mean “fear” in a dictionary, but “surprise/shock” on Twitter. To make the tool robust, the researchers curated a list of domain-specific stop words—terms that have emotion associations in standard English but are used differently online or are too generic.
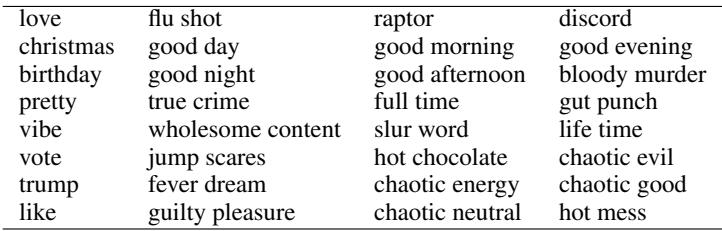
As seen in Table 3, terms like “chaotic evil” (a meme format) or “glue” words like “vibe” were removed to prevent noise. They also removed explicit mental health terms (e.g., “anxiety,” “depression”) so the model would detect underlying emotional patterns rather than simply identifying the diagnosis keywords.
2. Constructing Emotion Arcs
Once the text is cleaned, the tweets are ordered chronologically. The researchers then compute an “emotion score” for every utterance (tweet) or a window of words.
By plotting these scores over time, they create Emotion Arcs. An emotion arc represents the fluctuating intensity of a specific emotion across a user’s timeline.
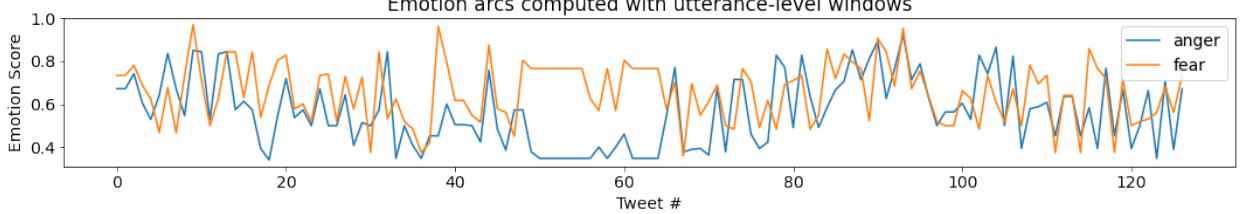
Figure 1 illustrates this concept perfectly. The blue line tracks “anger” and the orange line tracks “fear” for a single user over roughly 120 tweets.
- Observe the pattern: In some places, the blue and orange spikes happen simultaneously. In others, they diverge. The relationship between these two lines is what defines granularity.
3. Calculating Granularity: The Reverse Correlation
Here is the mathematical key to the study. To measure granularity, the researchers calculate the Spearman correlation between pairs of emotion arcs.
- High Correlation: If the “anger” arc and “sadness” arc move up and down together constantly, the correlation is high. This means the user is co-endorsing these emotions. In psychology terms, this is Low Granularity.
- Low Correlation: If the arcs are independent, the correlation is low. This means the user distinguishes between the emotions. This is High Granularity.
Therefore, the computational metric for Emotion Granularity (EG) is defined as the negative of the correlation.
\[ \text{Emotion Granularity} \approx -1 \times \text{Correlation(Emotion A, Emotion B)} \]The researchers calculated this for various groupings:
- EG(pos): Granularity among positive emotions (Joy vs. Trust).
- EG(neg): Granularity among negative emotions (Anger vs. Fear vs. Sadness vs. Disgust).
- EG(overall): The average across all same-valence pairs.
A Critical Control: Is it just vocabulary?
A skeptic might ask: “Maybe people with mental health conditions just use simpler language overall? Maybe they don’t know the specific words?”
To rule this out, the authors conducted a control experiment measuring Term Specificity. They calculated the “Information Content” of nouns and verbs used by both the MHC groups and the Control group using WordNet hierarchies.
The result? No significant difference. Users in the MHC groups did not use more generic nouns or verbs than the control group. This confirms that the observed differences in emotional expression are not a byproduct of general linguistic simplicity—they are specific to how emotions are experienced and processed.
Results: The Signature of Mental Health
The results of the study provide compelling evidence that text-derived emotion granularity is a biosocial marker for mental health.
The researchers compared the EG scores of the MHC groups against the control group. The findings, summarized in Table 2, show a stark contrast.
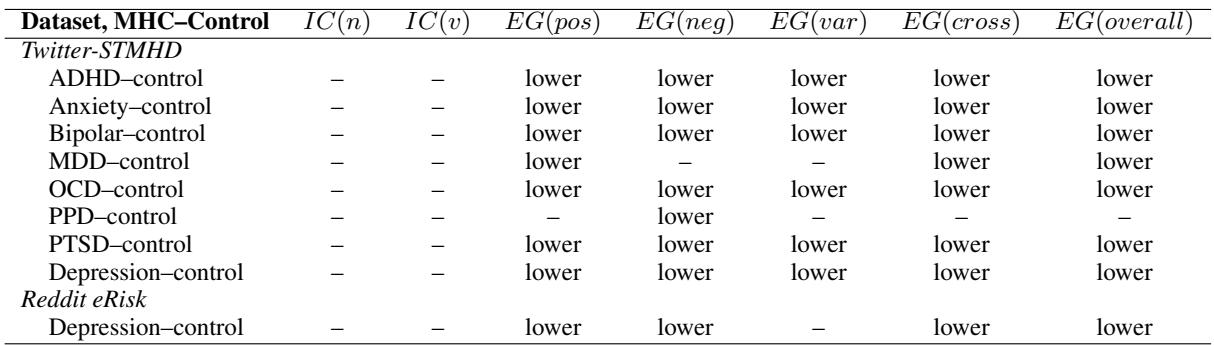
1. Negative Emotion Granularity (EG neg)
This is the most historically significant metric. As the table shows, EG(neg) is significantly lower for almost every mental health condition compared to the control group (indicated by the word “lower”).
- ADHD, Anxiety, Bipolar, Depression, OCD, PTSD: All show reduced ability to differentiate between negative emotions like anger, fear, and sadness.
- Implication: These users are statistically more likely to express negative emotions in clusters. When they tweet about something sad, they are likely to also frame it as angry and fearful simultaneously.
2. Positive Emotion Granularity (EG pos)
Interestingly, the pattern holds for positive emotions as well. Users with Anxiety, ADHD, OCD, and Depression showed significantly lower granularity between Joy and Trust. This suggests that the “blurring” of emotional states in mental health conditions isn’t restricted to bad feelings—it affects the processing of positive experiences too.
3. Overall and Cross-Valence Granularity
The EG(overall) column serves as the bottom line: across the board (except for Postpartum Depression in this specific table), individuals with MHCs have lower aggregate emotion granularity.
The EG(cross) column measures the relationship between opposing emotions (e.g., Joy vs. Sadness). A lower score here indicates that MHC users are more likely to co-endorse positive and negative emotions simultaneously—a phenomenon known as dialecticism. While complex to interpret, it further highlights a distinct emotional processing style compared to the control group.
Robustness of the Findings
To ensure these results weren’t a fluke of the specific window size (looking at one tweet at a time), the researchers repeated the experiments using larger sliding windows (100 words and 500 words).
As shown in Table 9 (using a 500-word window), the trends remain largely consistent. ADHD, Anxiety, Bipolar, and Depression groups continue to show significantly lower granularity. This confirms that the signal exists whether you look at a single tweet or a broader stream of consciousness.
Digging Deeper: Which Emotions Blur Together?
The researchers didn’t stop at aggregate scores. They broke down the correlations by specific emotion pairs to see exactly where the differentiation was failing.
Table 10 provides a granular (pun intended) look at these pairings.
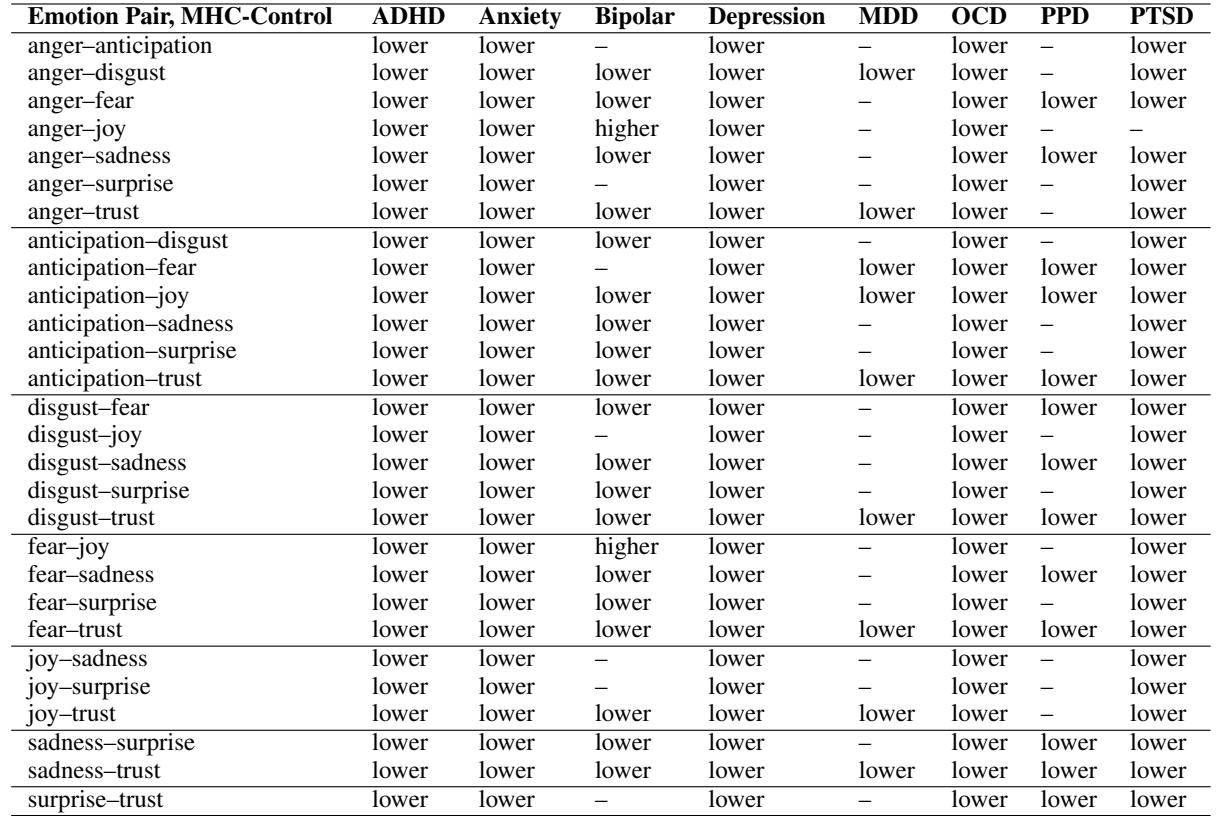
Key Observations:
- Anger-Sadness: This pair has lower granularity across almost all conditions (ADHD, Anxiety, Bipolar, Depression, OCD, PTSD). This is a classic indicator of maladaptive regulation—confusing the high-arousal state of anger with the low-arousal state of sadness.
- Anxiety & Depression: These groups show “lower” granularity across almost every single pairing. The emotional landscape is highly compressed.
- The Bipolar Anomaly: Look at the Anger-Joy and Fear-Joy rows for the Bipolar group. They are marked “higher.” This indicates that Bipolar users actually differentiate more between these cross-valence emotions than the control group. This aligns with the clinical understanding of Bipolar disorder, characterized by distinct, cycling phases of mania (Joy) and depression, rather than a muddy mixture of both.
To visualize the magnitude of these differences, we can look at the raw correlation coefficients in Table 12.
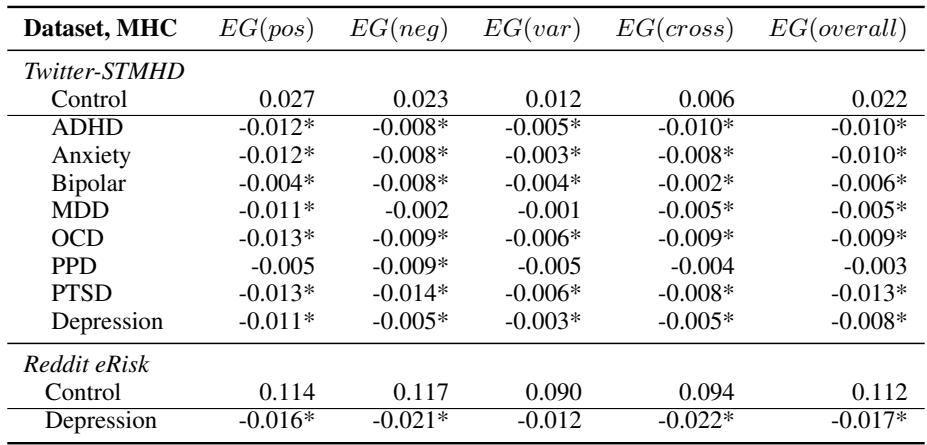
The “Control” row shows the baseline correlation. The rows below show the delta (difference).
- Note the negative values for EG(neg) and EG(pos) across the disorders.
- Since Granularity is the negative of correlation, a negative delta in this table implies the correlations are higher for the MHC groups, confirming that their granularity is indeed lower.
Conclusion and Future Implications
This research marks a significant step forward in computational linguistics and digital health. By moving beyond simple sentiment analysis, the authors have successfully operationalized a complex psychological construct—Emotion Granularity—using nothing but social media text.
The study demonstrates that:
- Text reflects psychology: The way we structure our emotional language on Twitter and Reddit mirrors the emotional differentiation patterns observed in clinical settings.
- Granularity is a marker: Lower emotion granularity is a robust aggregate-level indicator for a wide range of mental health conditions, particularly depression and anxiety.
- It’s structural: The difference lies in the relationship between emotion words, not just the vocabulary size.
What does this mean for the future? While the authors stress that this is not a diagnostic tool for individuals (you cannot diagnose a single user based on their tweets due to ethical and accuracy concerns), it offers a powerful lens for population-level mental health monitoring. Public health officials could potentially track the “emotional resolution” of communities to identify rising tides of mental distress before they manifest in crisis statistics.
Furthermore, it opens the door for therapeutic interventions. If low granularity is detectable in text, perhaps writing tools or therapeutic apps could be designed to help individuals differentiate their emotions better—nudging a user from “I feel bad” to “I feel anxious about X and sad about Y,” potentially fostering the very emotional resilience that granularity provides.