](https://deep-paper.org/en/paper/2404.08760/images/cover.png)
Introduction
Artificial Intelligence is rapidly becoming a ubiquitous interface for information, advice, and companionship. As we integrate Large Language Models (LLMs) like ChatGPT and Llama into daily life, a critical question arises: Whose values do these models reflect?
We often discuss bias in terms of race, gender, or political leaning. However, there is a demographic factor that is frequently overlooked but statistically massive: Age. By 2030, nearly 45% of the US population will be over 45 years old, and globally, one in six people will be over 60. If LLMs are trained primarily on internet data generated by younger, tech-savvy users, we risk creating systems that fundamentally misunderstand or misalign with a significant portion of humanity.
This deep dive examines the paper “The Generation Gap: Exploring Age Bias in the Value Systems of Large Language Models,” which investigates whether popular LLMs exhibit a “generational bias.” The researchers aligned LLM outputs against human data from the World Value Survey (WVS) to determine if AI “thinks” like a Gen Z digital native or a Baby Boomer.
The results reveal a stark reality: LLMs generally exhibit a strong inclination toward younger demographics. Perhaps even more surprisingly, simply telling the AI to “act like an older person” often fails to bridge this gap.
Background: Defining Human Values
To measure bias, we first need a ground truth. You cannot measure how “human-like” a model’s values are without a rigorous definition of human values across different cohorts.
The researchers utilized the World Value Survey (WVS). This is a well-established global research project that explores people’s values and beliefs, how they change over time, and what social and political impact they have. The survey probes individuals on categories ranging from social values and religious beliefs to perceptions of corruption and technology.

As shown above, the WVS asks respondents to rate the importance of family, work, and religion, or to gauge their trust in various groups. By grouping these human responses by age and country, the researchers created a “value fingerprint” for different generations. They then tasked LLMs with answering the same questions to see whose fingerprint the AI matched best.
The Core Method
The methodology of this paper is a fascinating blend of sociology and vector mathematics. The researchers needed to translate qualitative survey responses into quantitative data that could be compared mathematically.
1. Robust Prompting
One of the notorious difficulties in evaluating LLMs is their sensitivity to prompt phrasing. A slight change in wording can flip an answer. To counter this, the authors didn’t just ask each survey question once. They designed eight distinct prompt variations for each inquiry.
These variations shuffled the order of options, changed the context slightly, or altered the output format requirements. They found that while LLMs can be unstable, averaging the responses across these eight prompts provided a converged, reliable “opinion” for the model.
2. Mathematical Representation
Once the researchers collected the LLM’s answers and the human data (stratified by age groups like 18-24, 25-34, up to 65+), they needed to measure the distance between them.
First, they represented the values for a specific category \(c\) (e.g., “Religious Values”) as a vector. If a category had \(n\) questions, the vector looked like this:
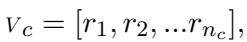
Here, \(r_i\) represents the numeric response to the \(i\)-th question.
Because a vector with dozens of dimensions is hard to analyze, the team used Principal Component Analysis (PCA). PCA is a dimensionality reduction technique that compresses the information into a smaller space while retaining the most important variances. They transformed the high-dimensional survey data into a 3D coordinate system:

Now, every age group and every LLM exists as a single point in this 3D “value space.”
3. Measuring the Gap
To quantify how far an LLM’s values are from a specific age group, the researchers calculated the Euclidean Distance between the LLM’s point (\(M\)) and the human age group’s point (\(i\)).

A smaller distance (\(d\)) means the LLM’s values are more similar to that human age group.
Finally, to visualize which group the AI preferred, they used an Alignment Rank. For every question category, they calculated the distance to all six age groups and ranked them. If the 18-24 group was ranked #1, the model is most aligned with the youngest generation.

4. The Trend Coefficient
The most innovative metric introduced is the Trend Coefficient. This measures the slope of the gap. If the gap between the LLM and humans gets wider as the humans get older, the trend is positive (indicating a bias toward youth).

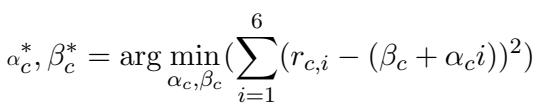
In simple terms: a positive \(\alpha\) (alpha) means the model drifts further away from you the older you get.
Experiments and Results
The study tested six major models: ChatGPT (GPT-3.5-turbo), InstructGPT, Mistral-7B, Vicuna-7B, FLAN-T5, and FLAN-UL2.
The General Inclination Towards Youth
The headline finding is visible in the scatter plot below. The chart displays the Trend Coefficients across various value categories.
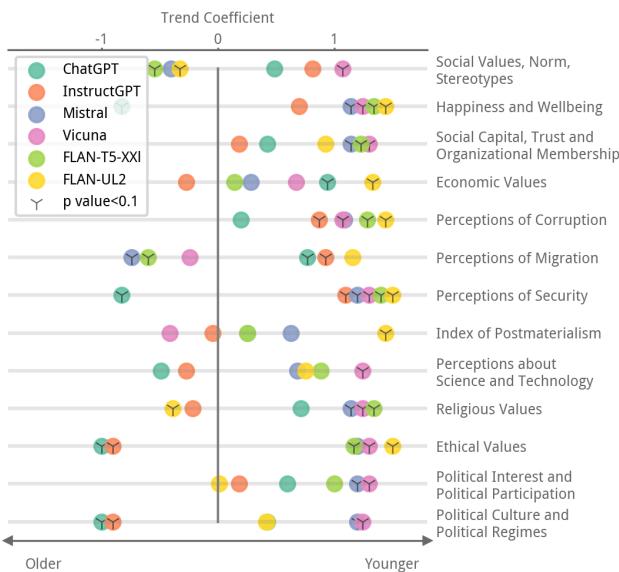
Notice the cluster of points on the right side of the graph (positive trend coefficients). This indicates that for categories like Social Values, Economic Values, and Religious Values, the models have a widening gap with older populations. The models are effectively “younger” in their outlook.
For example, younger individuals in the US tend to associate higher importance with economic values, while older cohorts prioritize religious values. The LLMs consistently tracked closer to the younger cohorts’ priorities.
Visualizing Alignment Ranks
To see this more clearly, we can look at the “Alignment Rank” charts. In these graphs, a lower rank (1) is better—it means that age group is the closest match to the LLM.
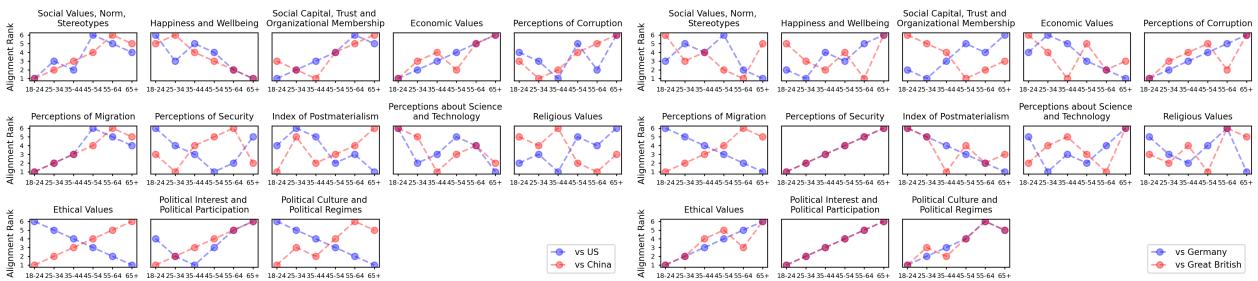
Look at the panel labeled (a) for ChatGPT in the US (the red circles). In many categories, the red line trends upward as age increases.
- Rank 1 (closest match) often falls on the 18-24 or 25-34 groups.
- Rank 6 (furthest match) often falls on the 65+ group.
This monotonicity confirms that the “values” of ChatGPT are not age-neutral; they degrade in alignment as the user gets older.
Case Study: Radio vs. Social Media
To make this abstract math concrete, the researchers highlighted specific questions where the disconnect is obvious.
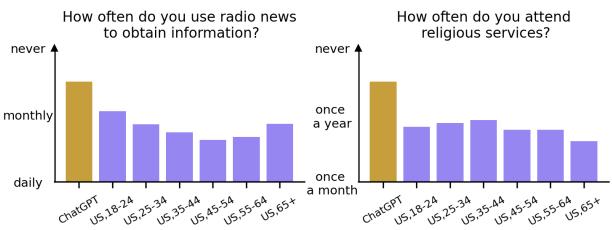
In the left chart above, the prompt asks about the frequency of using radio news.
- ChatGPT’s Answer: “Never” (the lowest bar).
- Human Data: While younger people listen to the radio less, older demographics still utilize it significantly. The model’s default “personality” assumes a digital-first lifestyle that ignores the habits of older populations.
Similarly, in the right chart regarding religious service attendance, ChatGPT selects “Never,” aligning itself with secular younger trends rather than the higher attendance rates found in older US demographics.
This is further illustrated by looking at the human ground truth for social media usage:
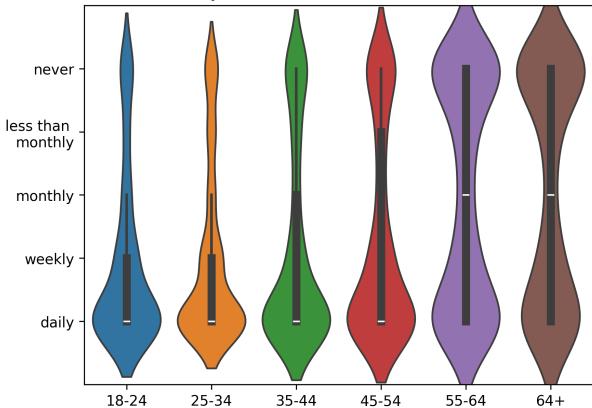
As expected, younger people (left side) use social media daily. Older people (right side) have a much broader distribution, with many never using it. An LLM that assumes “everyone is online” fundamentally misrepresents the lived reality of the 65+ demographic.
The “Role-Playing” Failure
A common technique in Prompt Engineering is Persona Adoption. If we want an LLM to align with an older user, we assume we can just say: “Suppose you are a 65-year-old from the USA…”
The researchers tested this hypothesis. They injected identity information into the prompts and re-ran the value alignment tests. The results were counter-intuitive and concerning.
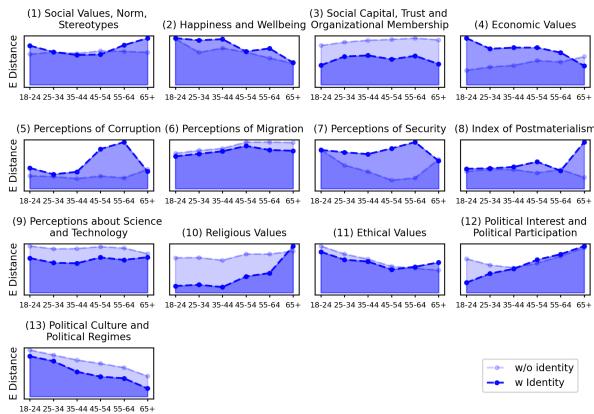
In the figure above, the dashed lines represent the standard prompt, and the solid blue lines represent the prompt with age identity added.
If the identity prompt worked, the solid blue line should drop significantly lower than the dashed line, especially for the older age groups (right side of the x-axis).
- The Reality: In 8 out of 13 categories (including Social Values, Economic Values, and Religious Values), adding the identity information failed to eliminate the value discrepancy. The lines often overlap or stay high.
The model struggles to “step out” of its training bias. It knows it should act like an older person, but its underlying value weights remain tethered to the younger, internet-dominant dataset it was trained on.
The Exception: Concrete Habits
There was one area where role-playing worked: concrete, stereotypical habits.
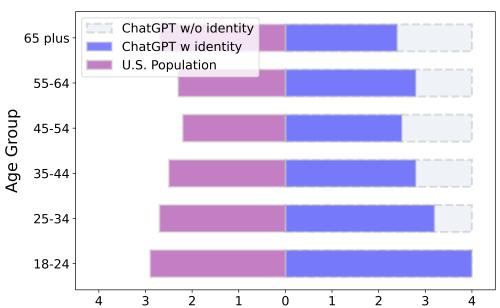
When specifically asked about radio usage while adopting a persona (Figure 5), ChatGPT successfully shifted its distribution. The “ChatGPT w/ identity” (blue bars) matched the “U.S. Population” (purple bars) much better, acknowledging that a 65+ year old is more likely to listen to the radio than an 18-year-old.
This suggests LLMs can mimic stereotypes or behaviors (like listening to the radio) but struggle to fundamentally shift their value systems (like deep ethical or religious views) to match an age identity.
Conclusion and Implications
This research highlights a “Generation Gap” in AI. LLMs are not neutral observers; they are mirrors reflecting the data they consume, and that data is overwhelmingly young.
Why does this matter?
- Trust and Safety: Older adults generally place higher trust in established institutions. If they interact with an LLM that appears authoritative but provides information misaligned with their context (or hallucinates), they may be more vulnerable to misinformation than a skeptic digital native.
- Empathy Deficits: An LLM acting as a companion to an older adult might fail to offer empathetic responses if it fundamentally holds “young” values regarding family structure, technology, or tradition.
- Alienation: If an LLM assumes the user is tech-savvy and secular, it creates friction for users who are not, potentially locking older adults out of the benefits of AI technology.
The Path Forward
The authors argue against a “brute-force” alignment where we simply force LLMs to mimic the average statistics of older people. This leads to stereotyping (e.g., assuming every older person is bad at technology).
Instead, the goal should be age-aware alignment. Future work needs to develop models that understand the variance in values across generations. An AI should be capable of detecting the user’s context and adjusting its helpfulness and harmlessness constraints accordingly, without simply defaulting to the worldview of a 25-year-old internet user.
As we build the future of intelligence, we must ensure it is wise enough to respect the values of the past.