](https://deep-paper.org/en/paper/2404.14215/images/cover.png)
Introduction
We live in an age of information overload. Every day, we are bombarded with massive chunks of unstructured text—news reports, financial transcripts, and live event commentaries. For humans, condensing this “wall of text” into a structured, easy-to-read table is a demanding task. We intuitively know that a table is often the best way to digest complex data, but creating one requires more than just reading; it requires reasoning.
In the field of Natural Language Processing (NLP), Text-to-Table generation is the task of automating this process. With the rise of Large Language Models (LLMs), you might assume this problem is solved. Can’t we just paste a document into GPT-4 and ask for a table?
As it turns out, it’s not that simple. Most existing models are great at “extraction”—finding a number in a sentence and copying it into a cell. They are significantly worse at “integration”—reading a long narrative, tracking events, performing calculations (like counting), and then filling the table.
In this post, we will dive deep into a paper titled “Text-Tuple-Table: Towards Information Integration in Text-to-Table Generation via Global Tuple Extraction.” The researchers identify a major gap in how we benchmark these models and propose a novel pipeline called \(T^3\) (Text-Tuple-Table) that mimics human reasoning to generate highly accurate tables from complex narratives.
The Problem: When Copy-Paste Isn’t Enough
To understand why Text-to-Table generation is hard, we first need to look at how previous research approached the problem. Historically, datasets like ROTOWIRE (basketball summaries) have been the standard. In these datasets, the task is often merely formatting.
For example, if a sentence says, “The Thunder defeated the Suns 112-88,” the model simply needs to extract “112” and “88” and place them in the correct columns. This is a one-to-one mapping.
However, real-world data is rarely this clean. Consider a live commentary of a soccer match. The text might describe five different “shots” on goal scattered across twenty paragraphs, using different synonyms like “header,” “strike,” or “attempt.” To generate a summary table row for “Total Shots,” the model cannot just extract a number; it must infer which events count as shots and integrate (sum) them up.
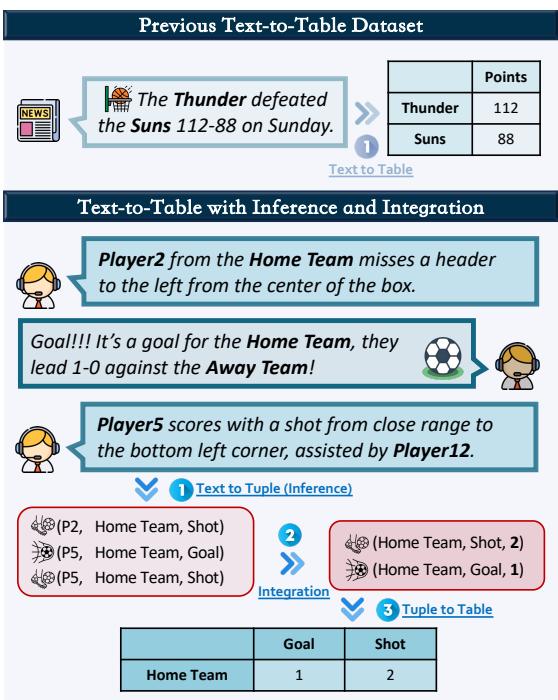
As shown in Figure 1, there is a massive leap in complexity between the top example (Previous Dataset) and the bottom example (Inference and Integration). The bottom example requires the model to track events (\(P2\) shot, \(P5\) goal) and aggregate them into a final statistic (2 shots, 1 goal).
Previous models often fail here because they rely on “spurious correlations”—guessing the output based on surface-level patterns rather than true understanding.
LIVESUM: A Benchmark for Reasoning
To address the lack of challenging datasets, the authors introduce LIVESUM, a benchmark dataset constructed from real-world football (soccer) match commentaries.
The goal of LIVESUM is to test an LLM’s ability to generate a match statistic table (Goals, Shots, Fouls, Cards, etc.) purely from the live text commentary.
Constructing the Dataset
Creating a high-quality dataset that requires reasoning isn’t easy. The researchers followed a rigorous pipeline:
- Original Live Text: They scraped live commentaries from BBC Sports.
- Paraphrasing: Using ChatGPT, they paraphrased the text to ensure diversity and match the style of human commentators.
- Anonymization: To prevent models from using pre-trained knowledge (e.g., knowing that Messi plays for Argentina), they replaced specific names with generic identifiers like “Player1” or “Home Team.” This forces the model to rely only on the provided text.
- Annotation & Integration: Human annotators labeled the events, which were then aggregated into ground-truth tables.
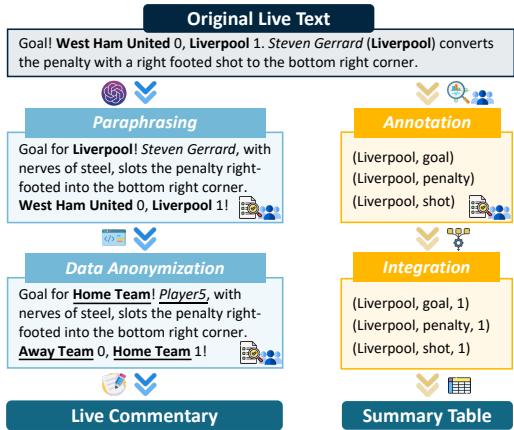
Figure 2 visualizes this pipeline. Notice how the sentence “Steven Gerrard… converts the penalty” is transformed and eventually distilled into data points like (Liverpool, goal, 1).
The Linguistic Challenge
One of the key features of LIVESUM is the variety of language used. A “Shot” isn’t always called a “shot.” It might be a “header,” a “miss,” a “save,” or a “goal.” The model must understand that all these distinct linguistic expressions map to the same statistical category.
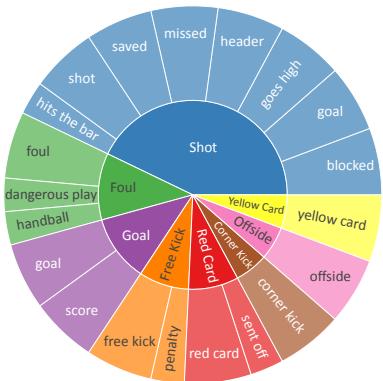
Figure 3 illustrates this difficulty. The inner circle shows the table headers (the goal), while the outer ring shows the noisy, varied text the model actually sees.
The Core Method: \(T^3\) (Text-Tuple-Table)
The researchers found that even powerful LLMs (like GPT-4) struggle with LIVESUM in a standard “Zero-Shot” setting (where you just ask the model to make the table). The models often hallucinate numbers or lose count in long texts.
To fix this, the authors propose the \(T^3\) Pipeline. This method breaks the complex task into three manageable steps, mimicking how a human would solve the problem: Extraction, Integration, and Tabulation.
Step 1: Text-to-Tuple (The Extraction Phase)
Instead of asking for the final table immediately, the model is first asked to extract atomic facts from the text in the form of tuples: (Subject, Object, Verb/Event).
For example, from the text “Player 5 kicked the ball over the bar,” the model extracts:
(Player 5, Home Team, Shot)
This step simplifies the unstructured text into a structured list of events, stripping away the narrative fluff while keeping the core data.
Step 2: Information Integration (The Reasoning Phase)
This is the most innovative part of the pipeline. Now that we have a list of raw tuples, we need to aggregate them (e.g., count how many shots the Home Team had).
The authors propose two ways to do this:
- Direct Execution: Ask the LLM to count them mentally.
- Code Generation: Ask the LLM to write a Python script to count the tuples.
The paper argues for Code Generation. LLMs are notoriously bad at arithmetic and counting over long sequences, but they are excellent at writing code. By generating a Python script to process the tuples, the “reasoning” is offloaded to a deterministic program, ensuring 100% accuracy in the calculation step.
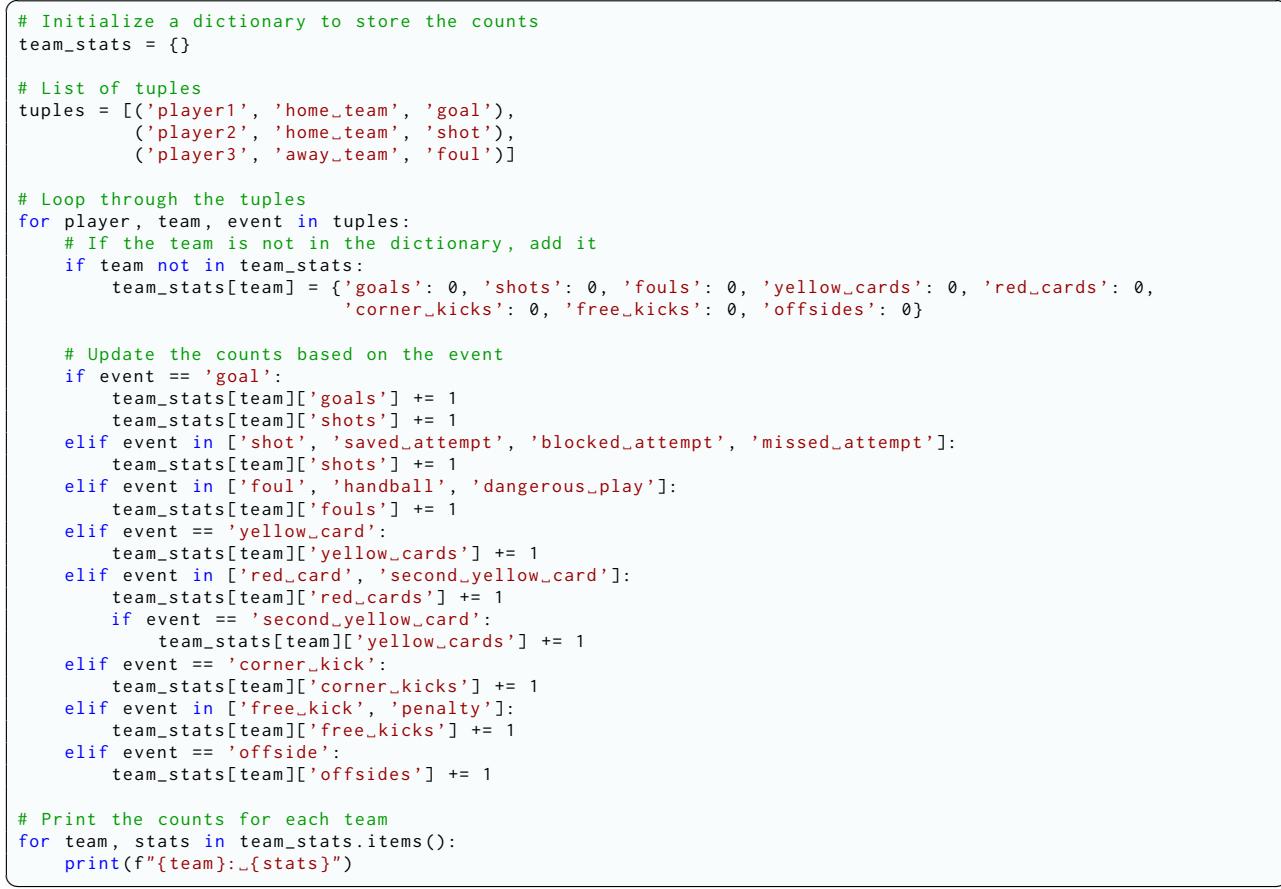
Figure 7 shows an example of the generated code. It initializes a dictionary, loops through the extracted tuples, and increments counters based on event types. This bridges the gap between the text and the final numbers reliably.
Step 3: Tuple-to-Table (The Generation Phase)
Finally, the integrated data (the counts outputted by the Python script) is fed back into the LLM (or a formatter) to generate the final table structure (CSV, Markdown, etc.). Since the hard work of reasoning was done in Step 2, this step is straightforward.
Experiments and Results
So, does breaking the task down actually help? The researchers tested various state-of-the-art LLMs, including GPT-4, Claude 3, and Mistral Large, on the LIVESUM dataset.
The Metrics
They used two primary metrics:
- RMSE (Root Mean Square Error): How far off were the numbers in the table? (Lower is better).
- Error Rate: The percentage of cells that were incorrect.
Key Findings
1. Zero-Shot LLMs Struggle Without the \(T^3\) pipeline, even the best models struggled.
- Easy categories (like Goals, which are explicitly stated) had low error rates.
- Hard categories (like Shots and Fouls, which require inference and counting) had error rates as high as 90% for some models.
2. \(T^3\) Delivers Massive Improvements Applying the \(T^3\) pipeline drastically reduced errors.
- GPT-4 saw its average Error Rate drop from 46.32% (Zero-Shot) to 25.27% (with \(T^3\)).
- Claude 3 Opus saw a massive improvement, dropping from 48.33% to 14.04%.
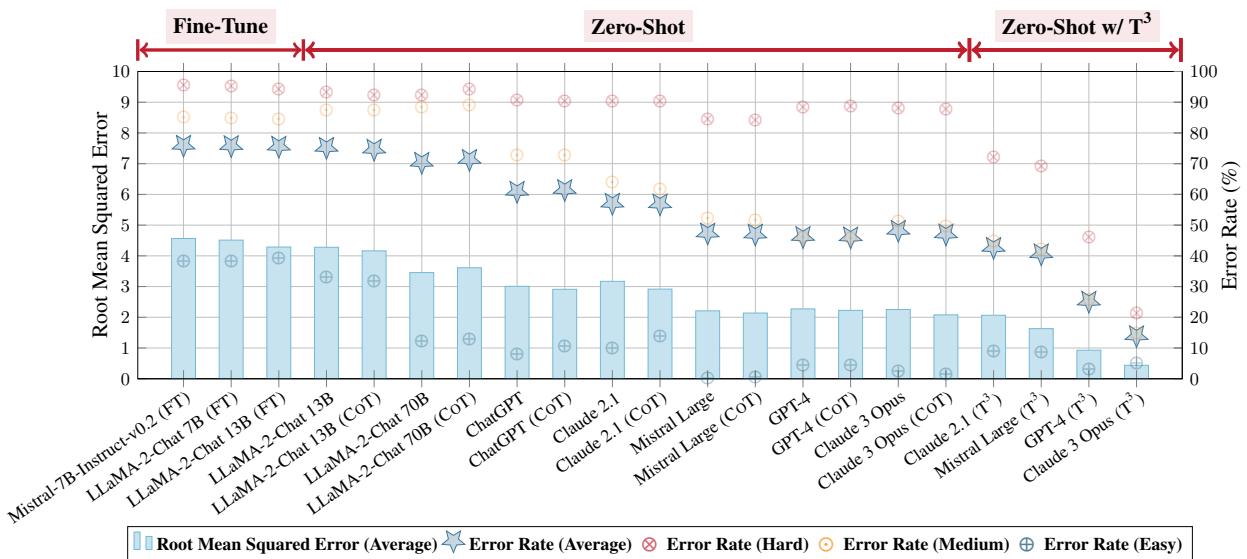
Figure 4 summarizes these results.
- The Red Line indicates the performance shift.
- Look at the Zero-Shot w/ \(T^3\) section on the right. The error rates (blue stars) plummet compared to the middle section (standard Zero-Shot).
- Notably, the \(T^3\) method often outperforms models that were specifically fine-tuned (trained) on the dataset, which is a remarkable achievement for a prompting-based strategy.
3. Code Generation vs. Mental Math The ablation studies (detailed analysis of specific components) confirmed that using code generation for integration (Step 2) is superior to asking the LLM to merge the tuples itself. GPT-4’s performance improved significantly when it acted as a programmer rather than a calculator.
Generalization: Beyond Football
A skeptic might ask: “Does this only work for sports?”
To prove the robustness of \(T^3\), the researchers applied it to the WIKI40B dataset, a general-purpose dataset derived from Wikipedia. Since there were no ground-truth tables, they used a metric called “Auto-QA Coverage”—essentially asking, “Can we answer questions about the text using only the generated table?”
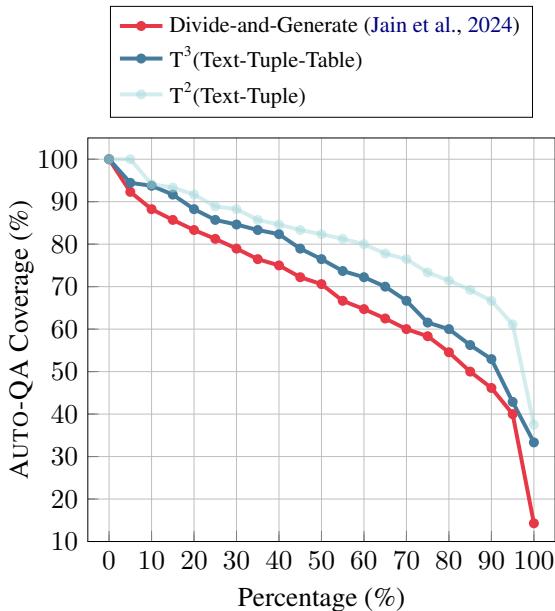
Figure 5 compares \(T^3\) against a previous state-of-the-art method called “Divide-and-Generate.”
- The x-axis represents the percentage of data.
- The y-axis represents the QA coverage (quality).
- The Blue Diamond line (\(T^3\)) consistently stays higher than the Red Circle line. This means \(T^3\) captures more accurate information from open-domain text than previous prompting strategies.
Conclusion and Implications
The paper “Text-Tuple-Table” highlights a critical evolution in how we use Large Language Models. We are moving away from treating LLMs as simple “text processors” and towards using them as “reasoning engines” that decompose problems.
Here are the key takeaways for students and practitioners:
- Structure Matters: The \(T^3\) pipeline works because it imposes structure (Tuples) on unstructured data early in the process.
- Tool Use is Powerful: Offloading logic and arithmetic to code (Python) is almost always better than relying on an LLM’s internal weights for calculation.
- Better Benchmarks Drive Progress: The LIVESUM dataset exposes weaknesses in models that previous, simpler datasets hid. We need benchmarks that test reasoning, not just formatting.
By extracting global tuples and integrating them programmatically, the \(T^3\) method paves the way for AI agents that can truly “read” a report and synthesize accurate, data-rich tables, regardless of the domain.