](https://deep-paper.org/en/paper/2406.19934/images/cover.png)
Introduction
Imagine showing a computer a photo of a messy kitchen and asking, “What year is displayed on the calendar attached to the refrigerator?”
For a human, this is a multi-step process. First, you scan the room to find the refrigerator. Second, you look for the calendar on it. Third, you zoom in to read the text. Finally, you deduce the year based on the visible month and days.
For a standard Vision-Language Model (VLM), however, this is a chaotic mess of pixels. Most current VLMs try to solve this in a single “glance,” often resulting in confident but incorrect hallucinations. They lack the ability to break a complex problem down into a logical chain of visual steps.
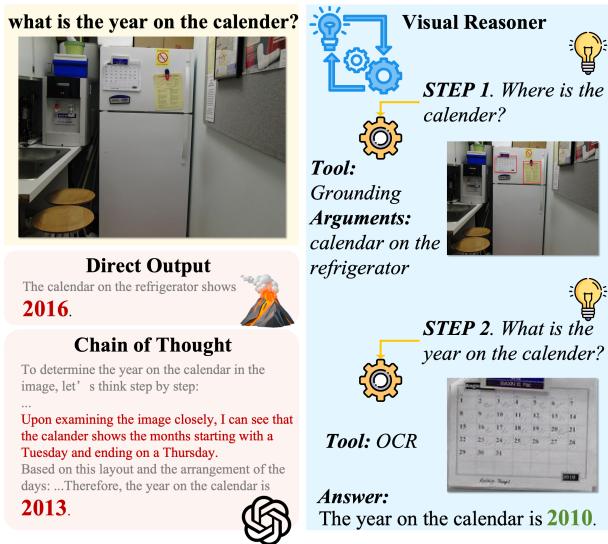
As shown in Figure 1, standard models (like LLaVA-NeXT or GPT-4o with simple prompts) might hallucinate a date based on general patterns. In contrast, the approach we are discussing today—Least-to-Most Visual Reasoning—mimics the human process: locate the fridge, locate the calendar, read the text, and solve the puzzle.
In this deep dive, we will explore a fascinating paper that proposes a solution to the “reasoning gap” in multimodal AI. The researchers introduce a plug-and-play Visual Reasoner and, perhaps more importantly, a novel Data Synthesis method that generates high-quality training data from scratch, bypassing the need for expensive human annotation or proprietary API costs.
The Background: Why VLMs Struggle with Logic
Large Language Models (LLMs) have mastered reasoning through techniques like “Chain-of-Thought” (CoT), where the model explicitly writes out its thinking steps. Naturally, researchers want to bring this capability to Vision-Language Models (VLMs).
However, visual reasoning is fundamentally different from text reasoning.
- Tool Requirement: Visual reasoning often requires manipulating the image—zooming in, cropping, or running Optical Character Recognition (OCR)—before an answer can be found.
- Data Scarcity: This is the biggest bottleneck. There are millions of text documents containing logical arguments, but there are very few datasets containing “visual reasoning chains” (e.g., “Step 1: Look at the dog. Step 2: Look at the bowl next to the dog. Step 3: Check if the bowl is empty”).
Standard VLMs are trained on image-caption pairs. They are great at describing what is in an image, but terrible at deducing why or how things relate in a complex sequence. The authors of this paper argue that to fix this, we need two things: a new inference paradigm that uses tools, and a way to mass-produce data to teach models how to use those tools.
The Core Method
The researchers propose a comprehensive system divided into two main parts: the Least-to-Most Visual Reasoning inference engine and the Least-to-Most Synthesis data generation pipeline.
Part 1: Least-to-Most Visual Reasoning
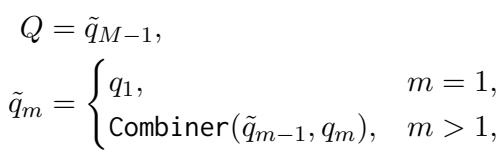
The core idea is to stop treating Visual Question Answering (VQA) as a single-step classification task. Instead, the model acts as a “Reasoner” (denoted as \(\mathcal{M}_R\)) that decomposes a main question \(Q\) into a sequence of sub-questions and tool invocations.
This is an iterative process. At every step \(k\), the Reasoner looks at the current image state \(I_k\), considers the history of previous steps, and decides what to do next.
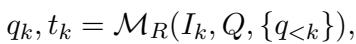
Here, \(q_k\) is the next sub-question (e.g., “Where is the calendar?”) and \(t_k\) is the tool selected to answer it.
The Toolset
The Reasoner doesn’t just “think”; it acts. The authors defined a set of four specific tools that cover the majority of visual reasoning needs:
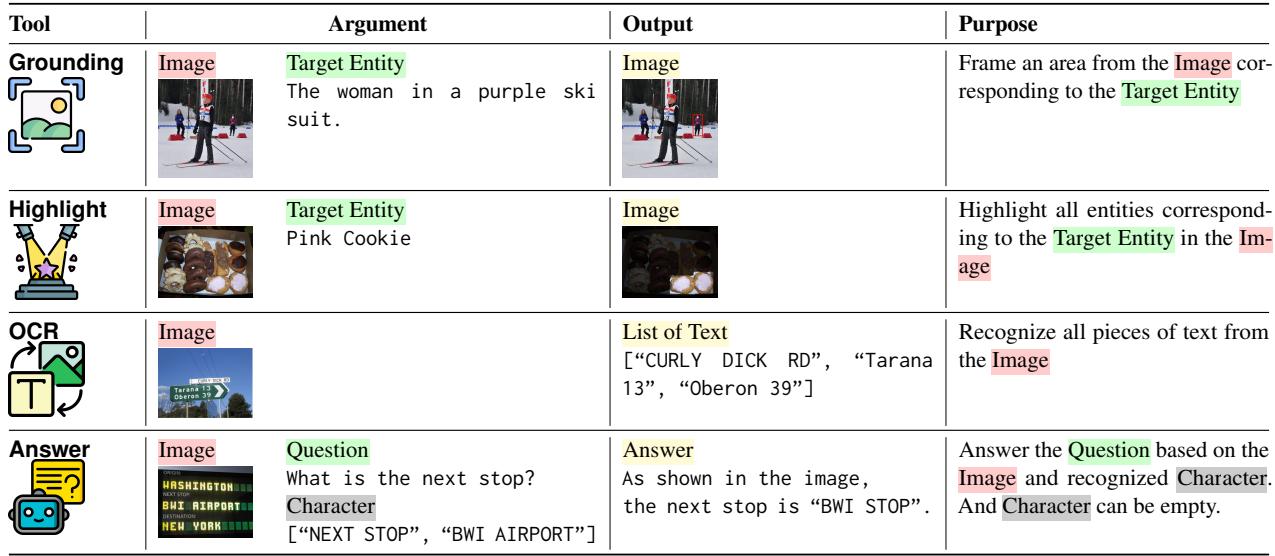
- Grounding: Finds an object and returns a cropped image of it. This allows the model to “focus” attention.
- Highlight: Masks the image to highlight specific objects. This is crucial for counting tasks (e.g., “Highlight all the people rowing”).
- OCR: Reads text from the image.
- Answer: This is where the magic happens. This tool calls an external, off-the-shelf VLM to answer a specific sub-question based on the processed image.
The Reasoning Loop
When the Reasoner selects a tool and gets a result (\(r_k\)), the image itself might be updated for the next step. For example, if the tool was “Grounding,” the next step’s input image (\(I_{k+1}\)) will be the cropped region, not the full original image.
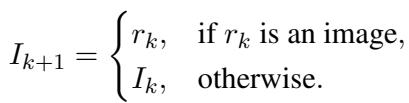
This allows the model to “zoom in” iteratively, removing distracting background noise as it solves the problem.
Part 2: Least-to-Most Synthesis (The Data Engine)
The architecture described above is powerful, but it requires a specialized dataset to train. We need thousands of examples of (Image, Complex Question, Reasoning Path). Creating this manually is impossible at scale.
The authors introduce a bottom-up synthesis approach. Instead of taking a complex question and trying to break it down (top-down), they start with the smallest details in an image and build a complex question up from them.
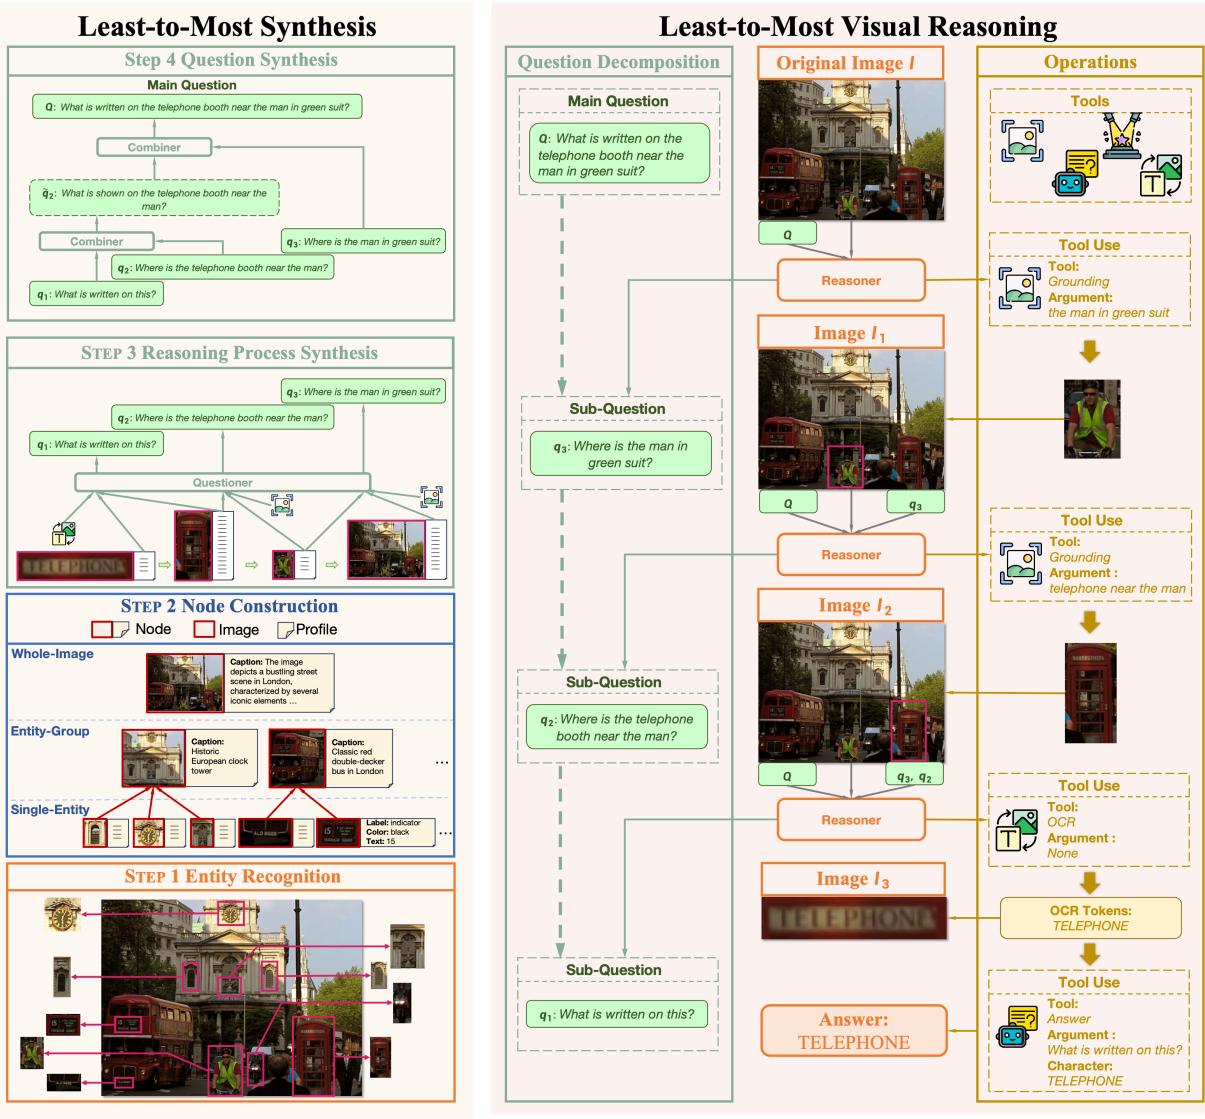
As illustrated in Figure 2 (Left), the synthesis pipeline has four distinct stages:
Step 1: Entity Recognition
First, the system needs to know what exists in the image. It uses an object detection model (specifically Deformable DETR) to recognize entities. It essentially catalogs everything: “There is a man,” “There is a bus,” “There is a clock.”
Step 2: Node Construction
This step converts visual information into text-based structured data, called “Nodes.” This is a brilliant move because it allows the rest of the synthesis process to be handled by text-only LLMs (which are faster and smarter than VLMs).
They create three types of nodes:
- Single-Entity Node: A specific object (e.g., the red bus). The system extracts attributes like color, location, and any text written on it.
- Entity-Group Node: A cluster of objects. A captioning model (BLIP) generates a description of how they interact.
- Whole-Image Node: A global view, captioned by a VLM (LLaVA) to provide context.
Step 3: Reasoning Process Synthesis
Now the system plays “connect the dots.” It samples a chain of nodes and uses an LLM (the “Questioner”) to generate a logical link between them.
For example, if Node A is “Man” and Node B is “Telephone Booth,” the Questioner might generate a sub-question like “What is near the man?” with the answer pointing to the booth.

The Questioner generates the sub-question \(q_m\) and the tool arguments \(\hat{t}_m\) needed to move from one node to the next. By chaining these, the system creates a multi-step reasoning path: Find Man -> Find Booth -> Read Text on Booth.
Step 4: Question Synthesis
Finally, the system needs the “Main Question” that triggers this whole chain. Another LLM (the “Combiner”) takes the sequence of sub-questions and merges them into a single, natural language query.
If the sub-questions were “Where is the man?”, “What is next to him?”, and “What does the text say?”, the Combiner outputs: “What is written on the telephone booth near the man in the green suit?”
Visualizing the Data Construction
To make this concrete, let’s look at an example involving a Bento box.

In Figure 8, the system identifies almonds, broccoli, and the box structure. It builds nodes for these items. It then synthesizes a reasoning path:
- Find the green food (broccoli).
- Look to the left of the broccoli to find the almond.
- Identify the container holding the almond.
The final synthesized question becomes complex: “What is in the box that contains the almond located to the left of the green food?”
This bottom-up approach ensures the data is hallucination-free (because it’s grounded in detected objects) and cost-efficient (using open-source models). Using this method, the authors created the VIREO dataset containing 50,000 visual reasoning examples.
Experiments & Results
The authors fine-tuned an LLaVA-1.5-7B model on the VIREO dataset to act as the “Reasoner.” They then plugged this Reasoner into various other VLMs (the “Answer” tools), including BLIP-2, InstructBLIP, and base LLaVA models.
The evaluation covered four major benchmarks: GQA (relations), TextVQA (reading text), and TallyQA (counting, split into Simple and Complex).
Main Performance
The results were compelling. As shown in Table 2, adding the Visual Reasoner improved performance across the board.
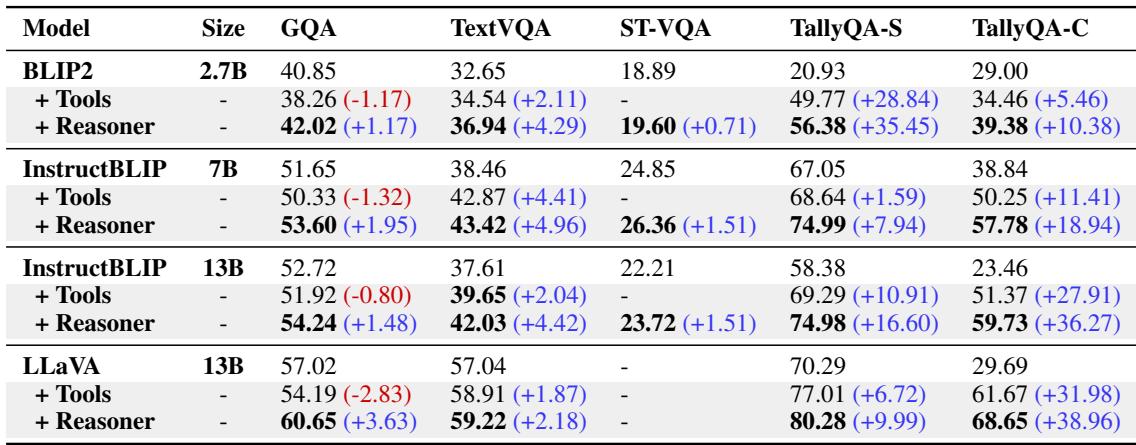
Key takeaways from the results:
- Consistent Gains: Whether the base model was small (BLIP-2 2.7B) or large (InstructBLIP 13B), the Reasoner improved accuracy.
- Massive Counting Improvement: Look at the TallyQA scores. For LLaVA-13B, performance on TallyQA-Complex jumped from 29.69% to 68.65%. This is a massive leap, largely attributed to the “Highlight” tool which allows the model to visually tag items while counting, rather than guessing.
- Reading Skills: TextVQA scores also improved significantly, proving that decomposing a “read this” task into “locate text -> run OCR -> interpret” is superior to end-to-end reading.
Scaling the Data
One logical question is: Does the synthesis method scale? If we generate more data, does the model get smarter?
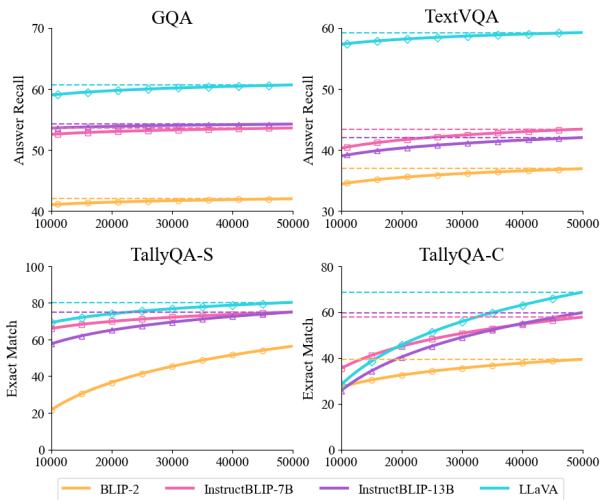
Figure 3 confirms that scaling the VIREO dataset from 1k to 50k examples leads to a steady upward trend in performance. While there are some diminishing returns, the trajectory suggests that synthetic data is a viable path to better reasoning.
Do We Need All the Tools?
The authors performed an ablation study to see which tools mattered most.
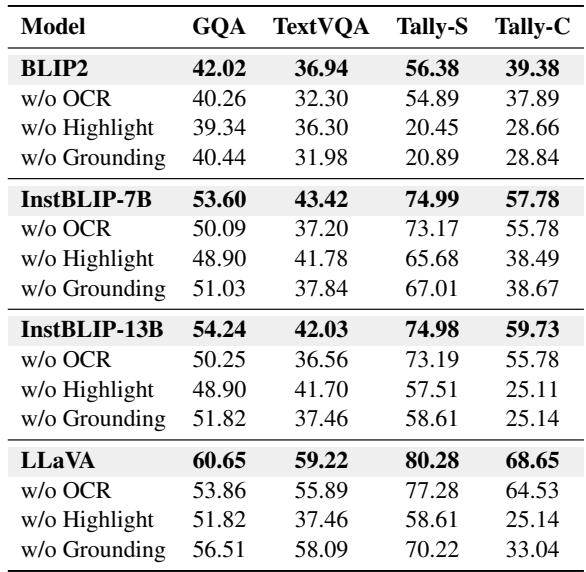
The results in Table 3 are revealing:
- Highlight is King for Counting: Removing the Highlight tool caused TallyQA-Complex scores to plummet (e.g., from 59.73 down to 25.11 for InstructBLIP).
- OCR is Vital for Text: Removing OCR hurt TextVQA performance significantly.
- Synergy: Removing any single tool degraded performance, indicating that the Reasoner successfully learned to switch between tools as needed.
Case Studies
Let’s look at the model in action to appreciate the “Least-to-Most” logic.
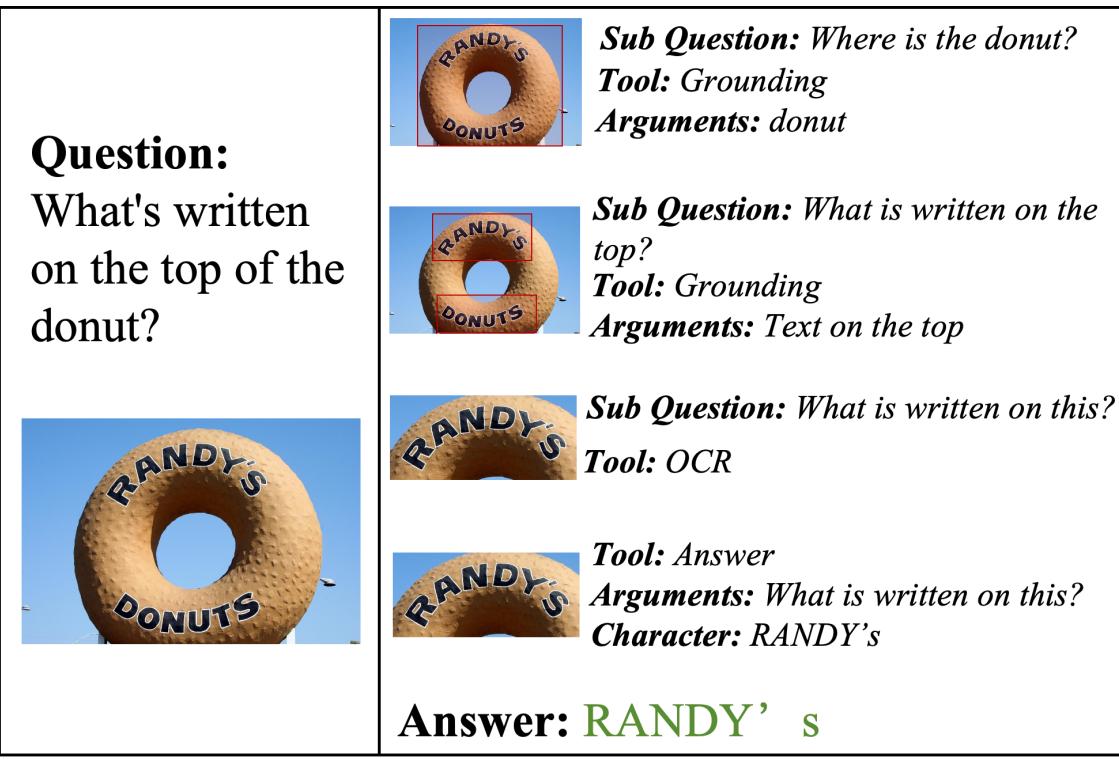
Case 1: Reading Text (The Donut Sign) In this example, the model needs to read a sign. It doesn’t just guess. It first grounds the object (the giant donut sign), then applies OCR, then answers.
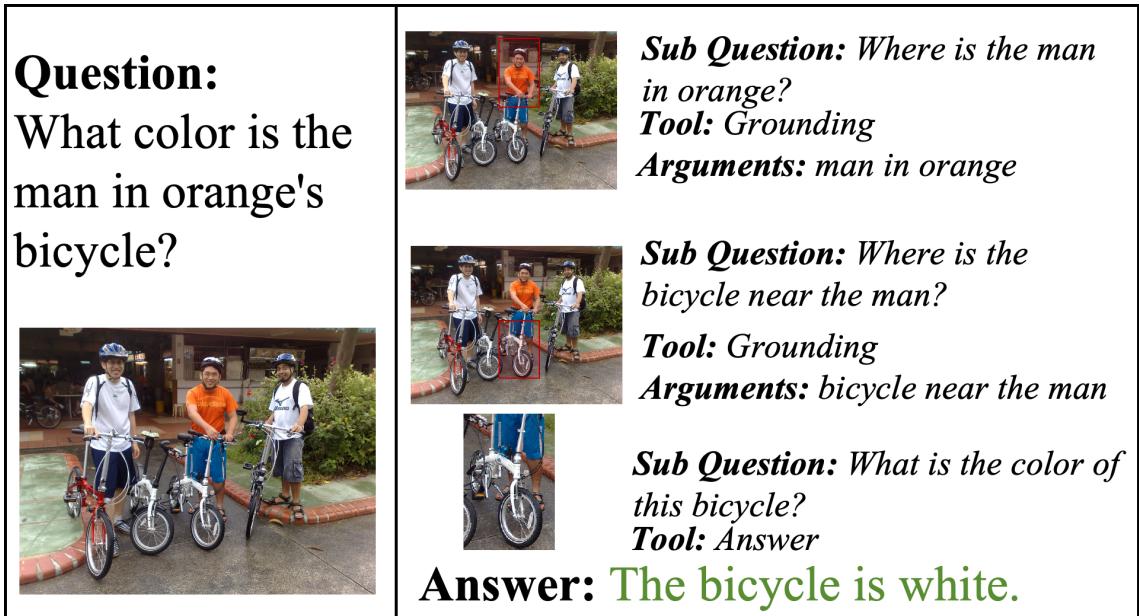
Case 2: Complex Relations (The Bicycle) Here, the question asks about the color of a specific bicycle: “the man in orange’s bicycle.” A standard model might just describe any bicycle. The Reasoner:
- Locates the “man in orange.”
- Locates the “bicycle near the man.”
- Identifies the color of that bicycle.
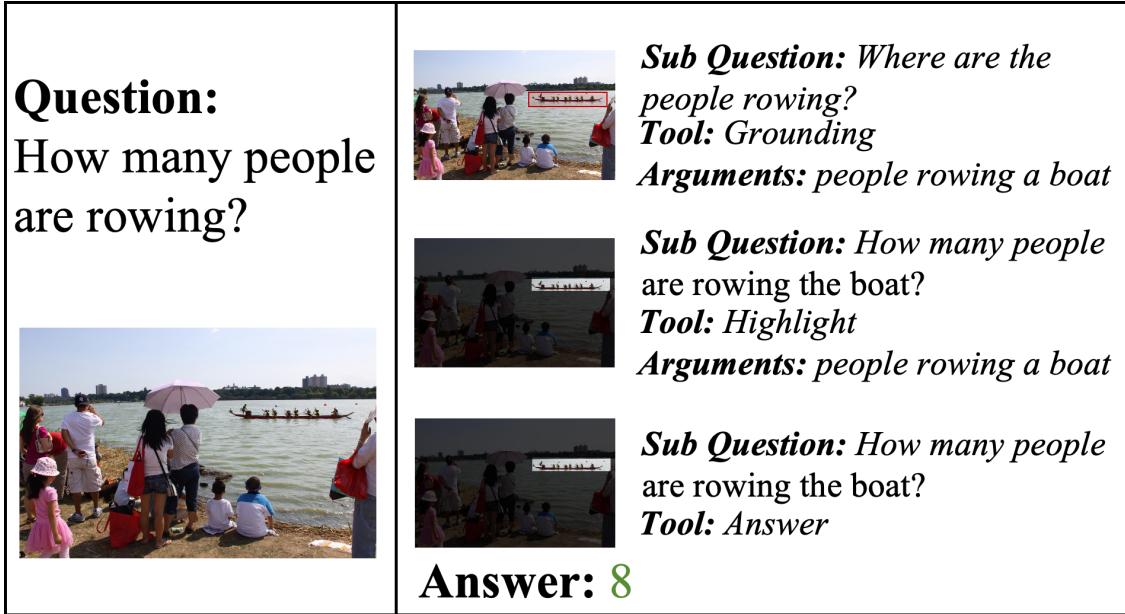
Case 3: Counting (The Rowers) Counting is notoriously hard for AI. Here, the Reasoner uses the Highlight tool to mask out the background and focus strictly on the people in the boat, arriving at the correct count of 8.
Conclusion & Implications
The paper “From the Least to the Most” offers a compelling solution to two of the biggest problems in multimodal AI: the lack of reasoning capabilities and the lack of reasoning data.
By treating visual reasoning as a modular, tool-assisted process, the authors show that even smaller, open-source models can achieve state-of-the-art results. The Reasoner acts as a sophisticated “manager,” delegating tasks to specialized tools (like OCR) or general workers (the Answer VLM).
Perhaps the most significant contribution, however, is the Data Synthesis pipeline. By proving that we can construct complex, high-quality reasoning chains from the bottom up using standard object detectors and LLMs, this work opens the door for massive, scalable training sets. We no longer have to wait for humans to annotate millions of images to teach computers how to think. We can just synthesize the curriculum.
This plug-and-play approach implies a future where AI systems are not monolithic “black boxes,” but modular systems that think, plan, and use tools to navigate the visual world—one step at a time.