](https://deep-paper.org/en/paper/2409.19984/images/cover.png)
Large Language Models (LLMs) have become the engines driving modern AI, from chatbots to code generators. In many of these applications, we don’t just care about the text the model generates; we care about the score—the probability the model assigns to a specific sequence of words. These scores are used to detect hallucinations, rank potential answers, and measure the model’s confidence.
But here is the uncomfortable question: Can we actually trust these numbers as mathematical probabilities?
In probability theory, consistency is key. If you calculate the probability of two events happening together (a joint probability), the result should be the same regardless of the order in which you calculate them. However, a recent research paper, “CONTESTS: a Framework for Consistency Testing of Span Probabilities in Language Models,” reveals that LLMs often fail this basic mathematical test.
In this post, we will break down the CONTESTS framework, explore why both Masked Language Models (like BERT) and Autoregressive Models (like Llama and T5) struggle with consistency, and look at the surprising ways model size affects these calculations.
The Core Problem: Order Matters When It Shouldn’t
To understand the problem, we need to revisit the chain rule of probability.
Imagine you have a sentence with two missing words (a span). Let’s say the sentence is “The sky is blue.” To calculate the joint probability of the words “sky” and “blue” appearing in those positions, you can approach it in two ways:
- Left-to-Right: Guess “sky” given the context, then guess “blue” given the context and “sky.”
- Right-to-Left: Guess “blue” given the context, then guess “sky” given the context and “blue.”
Mathematically, if \(P\) is a true probability distribution, these two calculations must yield the exact same number. This is a fundamental property of joint distributions.
\[P(sky, blue) = P(sky | context) \times P(blue | sky, context)\]\[P(sky, blue) = P(blue | context) \times P(sky | blue, context)\]If a language model produces different values for these two equations, it is probabilistically inconsistent. The researchers set out to measure exactly how inconsistent modern models are.
The CONTESTS Framework
The authors introduced CONTESTS (Consistency Testing over Spans), a statistical framework designed to quantify these discrepancies.
Defining the Probability Orders
The researchers focused on the joint probability of two adjacent tokens, \(x_i\) and \(x_{i+1}\). They defined two distinct ways a model can estimate this joint probability.
The first method approximates the standard left-to-right reading order (or filling the first mask, then the second):
In the image above:
- \(P_{i, i+1}\) is the probability calculated by predicting token \(i\) first, then token \(i+1\).
- \(P_{i+1, i}\) is the probability calculated by predicting token \(i+1\) first, then token \(i\).
In a perfect world, \(P_{i, i+1}\) and \(P_{i+1, i}\) would be identical.
Measuring the Discrepancy
To measure the difference between these two values, the researchers defined a metric called discrepancy (\(d\)). Because probabilities in LLMs are often incredibly small numbers, it is standard to work in log-space. The discrepancy is defined as the difference between the log-probabilities of the two orders:
If a model is perfectly consistent, \(d\) should be exactly 0. If \(d\) is positive, the model prefers the first order; if negative, it prefers the second.
Statistical Testing
Ideally, for a calibrated model, the distribution of discrepancy values across many different sentences should be centered at 0. The researchers used the Wilcoxon rank test to statistically determine if the models were biased away from 0.
The Competitors: MLMs vs. Autoregressive Models
The study compared two major families of Large Language Models:
- Masked Language Models (MLMs): Models like RoBERTa, XLM-RoBERTa, and ELECTRA. These are trained specifically to fill in missing words (masks) in a sentence. They are bidirectional by nature, looking at the whole sentence at once.
- Autoregressive Models: Models like Flan-T5, Llama 2, and Llama 2-Chat. These are typically trained to predict the next word in a sequence. To test them on this “fill-in-the-blank” task, the researchers provided specific prompts (e.g., “Passage: [text with mask]. Answer:”).
Experimental Results: The Consistency Gap
The researchers tested these models on multiple datasets, including Wikitext (which the models likely saw during training) and a newly collected News dataset (post-training cutoff) to ensure fairness.
The results, visualized below, show the distribution of discrepancy values (\(d\)) for each model.
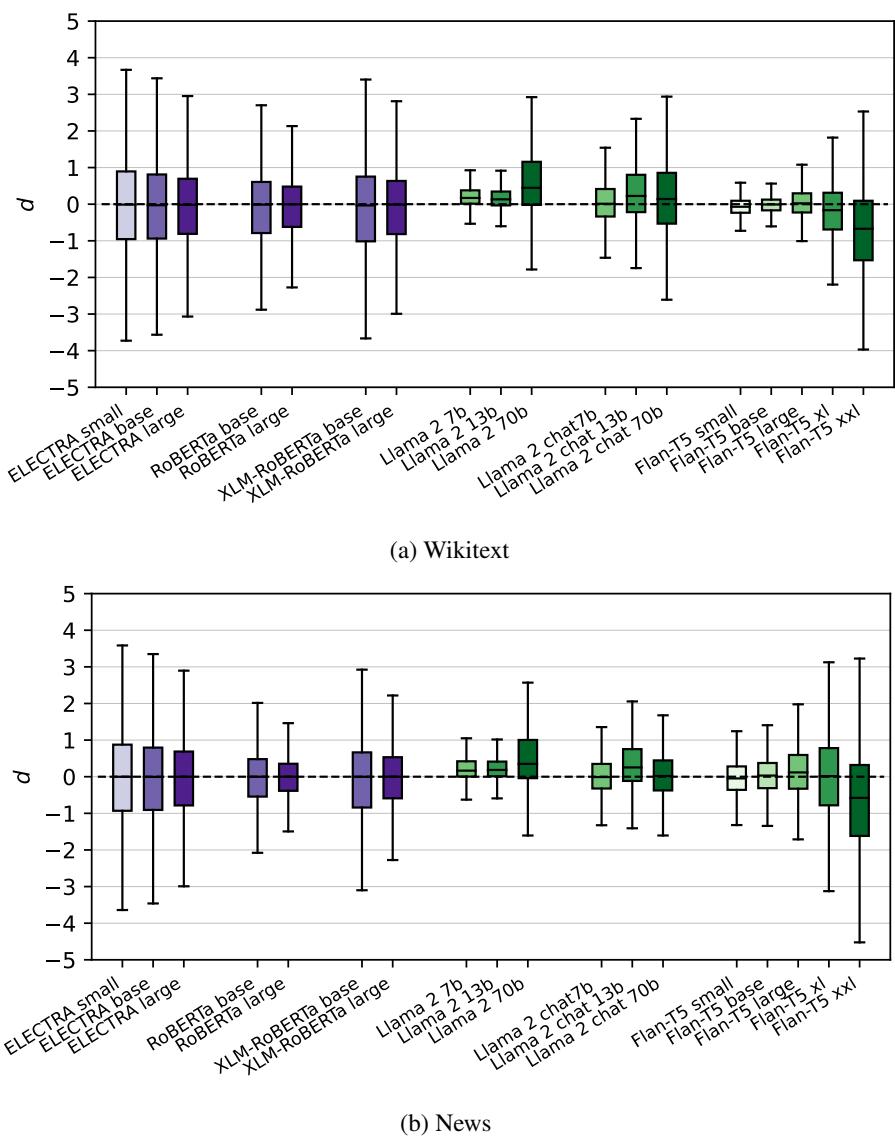
Key Observations from Figure 2:
- Everyone is Inconsistent: The dashed line at \(d=0\) represents perfect consistency. Almost no model stays strictly on that line. The statistical tests confirmed that for nearly every model, the deviation from 0 is statistically significant.
- The Purple vs. Green Divide: Look at the difference between the purple boxes (MLMs) and the green boxes (Autoregressive models).
- MLMs are much tighter and closer to 0. They are relatively consistent.
- Autoregressive models (especially Llama 2) show massive variance. Their estimations of joint probability fluctuate wildly depending on the decoding order.
The Synthetic Data Stress Test
To ensure these results weren’t just artifacts of specific natural language sentences, the researchers also generated a Synthetic Dataset using templates (e.g., “[MASK] [MASK] is a thing”). This allowed them to test how models handle lower-probability, controlled scenarios.
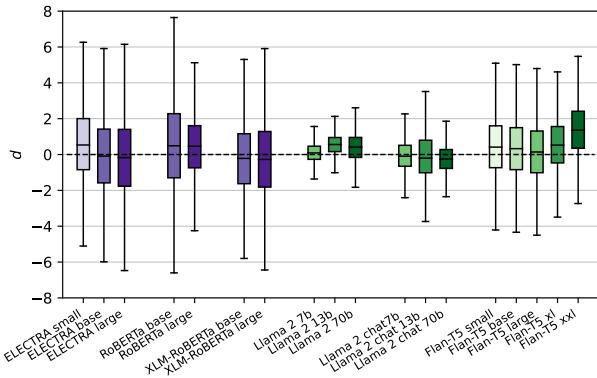
As shown in Figure 5, the trend holds but becomes even more pronounced. The discrepancies for MLMs (left) move further from zero, while the autoregressive models (right) continue to show high variance.
The Scaling Paradox: Bigger Isn’t Always Better
One of the most fascinating findings of this paper is how model size affects consistency. We generally assume that as we add more parameters (scale up), models get “better” at everything. The regression analysis performed by the researchers suggests otherwise for consistency.
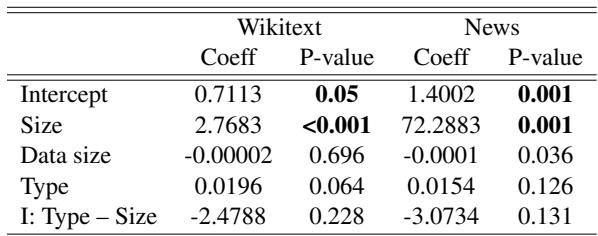
According to Table 1, there is a statistically significant relationship between model size and discrepancy variance. However, the nature of that relationship depends on the model architecture:
- MLMs: As they get larger, their variance tends to decrease. They become more consistent.
- Autoregressive Models: As they get larger (e.g., moving from Llama-7b to Llama-70b), their variance increases. They become less consistent.
This suggests that while giant generative models are incredible at writing essays, their internal probability calculations might be becoming more unstable or “opinionated” regarding calculation order as they scale.
Is It Just About Understanding the Prompt?
A valid counter-argument is that Autoregressive models (like Llama) aren’t built for “fill-in-the-blank” tasks. Maybe they are inconsistent simply because they don’t understand what they are being asked to do?
To investigate this, the researchers looked at two metrics:
- Rank: How highly did the model rank the correct word? (Lower rank is better).
- EOS Score: Did the model predict an “End of Sentence” token immediately after the word? If yes, it understood it was supposed to predict a single word. If no, it might have been trying to generate a whole sentence.
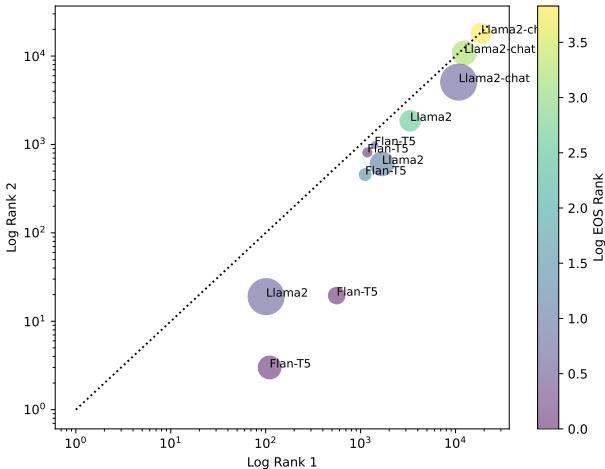
Figure 7 offers a nuanced view:
- The x and y axes show the rank of the correct word (lower is better/left-down).
- The Color indicates the EOS rank (Purple = good task comprehension).
- The Size indicates model parameters.
We can see that Llama 2-Chat (the large circles in the top right) performs poorly on ranking the correct word, despite often having decent task comprehension (purple color). Conversely, Flan-T5 and base Llama 2 models (bottom left) understand the task well and rank words accurately, yet we know from previous charts they are still highly inconsistent.
This implies that inconsistency is not merely a side effect of failing to understand the prompt; it is an inherent characteristic of the models’ probability estimations.
Practical Implications: Which Order Should You Choose?
If we know the models are inconsistent—meaning \(Order A \neq Order B\)—can we predict which order is “better” (i.e., yields a higher probability for the correct answer)?
The researchers found a connection between Entropy (a measure of uncertainty) and the accuracy of the prediction order.
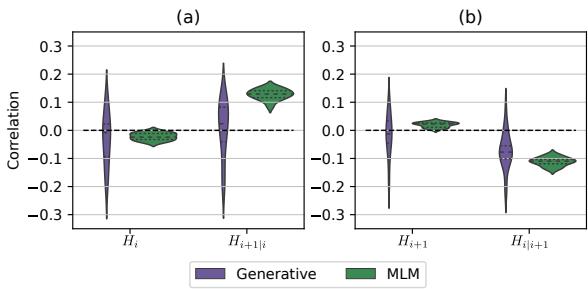
Figure 4 illustrates the correlation between entropy and discrepancy. The key takeaway is somewhat counter-intuitive but actionable:
- Positive correlation for single-mask entropy (\(H_{i+1|i}\)): If the model is very uncertain (high entropy) about the second word it has to fill, that direction tends to yield a higher probability score.
- Negative correlation for two-mask entropy (\(H_{i}\)): If the model is very uncertain about the first word (when both are missing), that direction tends to yield a lower score.
The Strategy: To maximize the likelihood of the true tokens, you should choose the decoding order where the single-mask prediction has higher entropy and the two-mask prediction has lower entropy.
Conclusion
The CONTESTS framework exposes a fundamental “messiness” in how Large Language Models handle probability. While we often treat LLM scores as rigorous mathematical probabilities, this research demonstrates that they are sensitive to the order in which we ask the questions.
- MLMs generally adhere closer to mathematical consistency, especially as they scale up.
- Autoregressive models (the current standard for GenAI) are significantly less consistent, and scaling them up seems to exacerbate the issue.
For students and practitioners, this serves as a crucial warning: Do not treat LLM probability scores as absolute truth. They are estimates that fluctuate based on calculation methods. However, by understanding these inconsistencies—and their relationship with entropy—we can design smarter decoding strategies to get the best out of these powerful models.