](https://deep-paper.org/en/paper/2501.19334/images/cover.png)
In the world of data science and public policy, there is a pervasive assumption: better models lead to better outcomes. We spend countless hours tuning hyperparameters, gathering more features, and chasing that extra 0.01 boost in AUC or \(R^2\). The logic seems sound—if we can more accurately predict who is at risk of poverty, unemployment, or dropping out of school, we can more effectively target our help.
But what if the bottleneck isn’t the algorithm? What if the best way to help the worst-off isn’t a smarter AI, but simply a larger budget to help more people?
This is the central question posed in the research paper “The Value of Prediction in Identifying the Worst-Off.” The researchers challenge the blind pursuit of predictive accuracy by introducing a rigorous framework to compare two distinct policy levers: improving prediction versus expanding access (screening capacity).
Through theoretical modeling and a massive real-world case study on unemployment in Germany, they reveal a counter-intuitive truth: in many practical scenarios, investing in “smarter” systems yields diminishing returns compared to simply widening the net.
The Problem: Allocation in Resource-Constrained Environments
Imagine you are a policymaker running a social program. You have a limited budget and can only provide intensive support to a small fraction of the population—let’s say the top 10% most at-risk individuals. Your goal is to identify the “worst-off” (e.g., those most likely to face long-term unemployment) and intervene.
You have two main knobs you can turn to improve this system:
- Improve Prediction: Invest in better data and complex machine learning models to rank individuals more accurately.
- Expand Access: Invest in more case workers or resources to increase the number of people you can screen and help (e.g., moving from helping the top 10% to the top 12%).
Current trends in empirical public policy heavily favor the first option. Agencies focus on incremental improvements in risk scores. However, these improvements come with costs—data infrastructure, technical debt, and opacity. This paper provides the missing framework to determine which investment actually provides more “value.”
The Framework: Prediction vs. Access
To make this tradeoff mathematical, the authors define a specific problem setting. We have a population with true welfare outcomes \(Y\) (e.g., future income or employment duration). We want to identify the fraction \(\beta\) of the population that is worst-off.
However, we don’t know \(Y\) in advance. We only have a predictor \(f(x) = \hat{Y}\). We also have a resource constraint \(\alpha\), which is the fraction of the population we can afford to screen or treat.
The Value of our system is defined as the probability that we successfully screen someone who is actually in the worst-off group.

Here, \(t(\alpha)\) and \(t(\beta)\) are the thresholds for the screening capacity and the target at-risk group, respectively. Put simply: Of the people who really need help, what percentage did our system successfully catch?
The Prediction-Access Ratio (PAR)
The core contribution of this paper is a new metric called the Prediction-Access Ratio (PAR). This metric tells us the relative “bang for your buck” of expanding access compared to improving prediction.
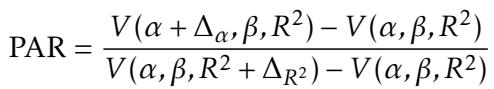
The PAR compares the marginal gain in value from a small increase in capacity (\(\Delta_\alpha\)) against the marginal gain from a small increase in predictive accuracy (\(\Delta_{R^2}\)).
- If PAR > 1: Expanding access is more effective. You get more value by helping slightly more people than by making your model slightly smarter.
- If PAR < 1: Improving prediction is more effective. You should focus on data quality and modeling.
To make an economic decision, you simply compare the PAR to the relative costs of these improvements.
If the ratio of the cost of access to the cost of prediction is less than the PAR, you should buy more access.
Theoretical Insights: The Gaussian Model
To build intuition, the authors first analyze this problem using a simplified “toy model” where outcomes and errors follow a Normal (Gaussian) distribution. In this clean mathematical world, the quality of the predictor is perfectly captured by the coefficient of determination, \(R^2\).
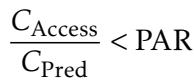
Visualizing the policy helps us understand the trade-offs.
In Figure 1 above, we see three scenarios:
- (a) Left: The baseline. The black curve shows the probability of being screened given your true outcome \(Y\). Notice it’s not a perfect step function—some needy people (left of the vertical line) are missed, and some less needy people are screened.
- (b) Middle: Expanding Access (\(\alpha\)). The curve shifts up. We catch more of the worst-off, simply because we are screening more people in general.
- (c) Right: Improving Prediction (\(R^2\)). The curve becomes steeper. The system becomes better at distinguishing the needy from the non-needy, shifting probability mass to the left.
The question is: which shaded area (the gain in value) is larger?
The “First and Last Mile” of Prediction
One of the most striking theoretical results is what the authors call the “First and Last Mile” effect.
They found that improving prediction is most valuable in two extreme states:
- The First Mile: When you know almost nothing (\(R^2 \approx 0\)). Moving from random guessing to a basic model helps immensely.
- The Last Mile: When you are already very accurate and your capacity matches the target group size (\(\alpha \approx \beta\)). Here, refining the model helps perfect the allocation.
However, in the messy “middle”—where most real-world systems operate—expanding access often wins.
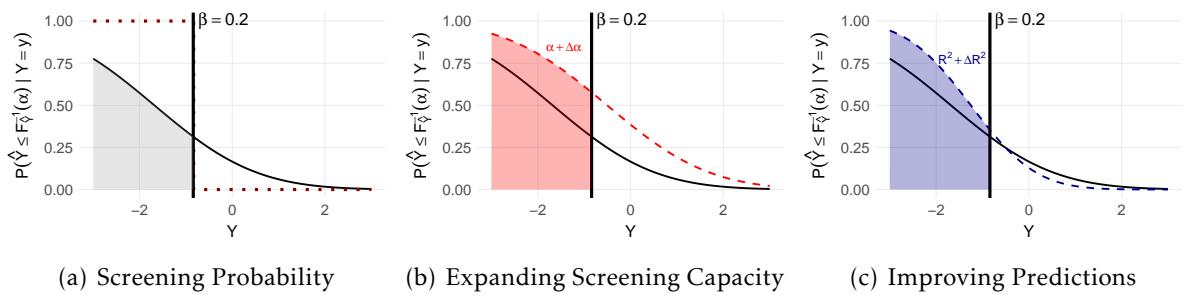
Figure 2 visualizes the PAR across different capacities (\(\alpha\)) and accuracies (\(R^2\)).
- The red/orange areas indicate where PAR is high (>1). This means expanding access is the dominant strategy.
- Notice the massive red area on the left. Theorem 3.1 in the paper proves that when screening capacity is scarce (small \(\alpha\)), the value of expanding access is overwhelming. If you can only help 1% of people, doubling that to 2% is far more impactful than tweaking your model.
- The blue areas (PAR < 1) appear mostly when predictions are terrible (bottom) or near-perfect (top right corner).
The takeaway? Unless your model is brand new or already near-perfect, you are likely in a zone where operational capacity matters more than algorithmic complexity.
Real-World Case Study: Long-Term Unemployment in Germany
Theoretical bounds are useful, but does this hold up in the complexity of the real world? To find out, the researchers applied their framework to a massive administrative dataset from the German Federal Employment Agency.
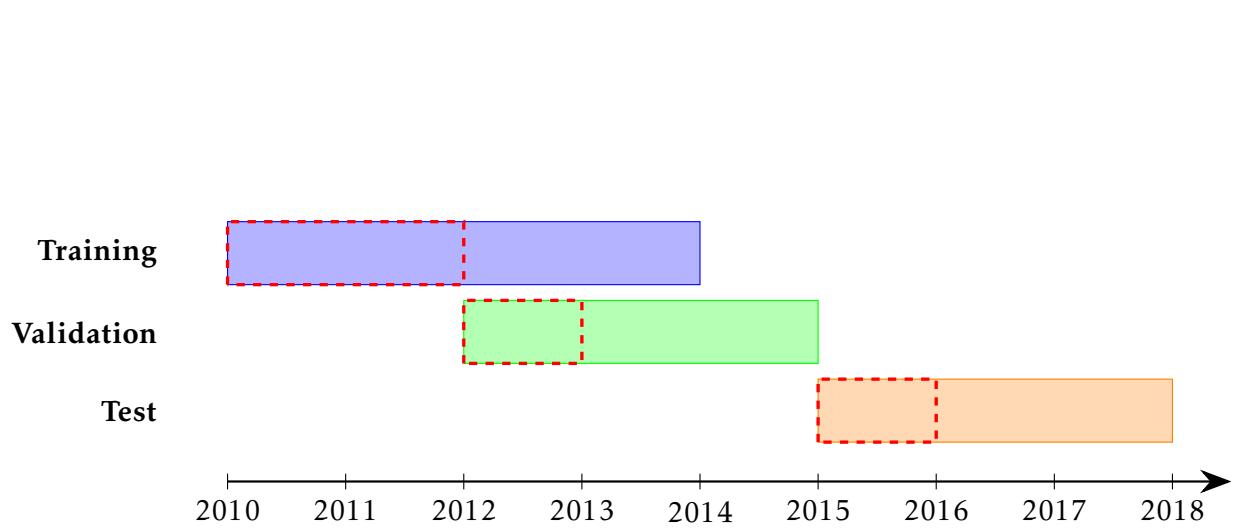
The Task: Predict long-term unemployment (LTU). The Data: Records on jobseekers, employment history, and benefits from 2010 to 2017. The Goal: Identify the “worst-off”—defined as those who will remain unemployed for more than 12 months (roughly 15% of the population, so \(\beta \approx 0.15\)).
They trained a gradient boosting model (CatBoost) to predict unemployment duration. The model achieved an \(R^2\) of roughly 0.15. This might sound low, but it is standard for complex social outcomes where human behavior is highly unpredictable.
Result 1: The Dominance of Access
The empirical results mirrored the theory almost perfectly.
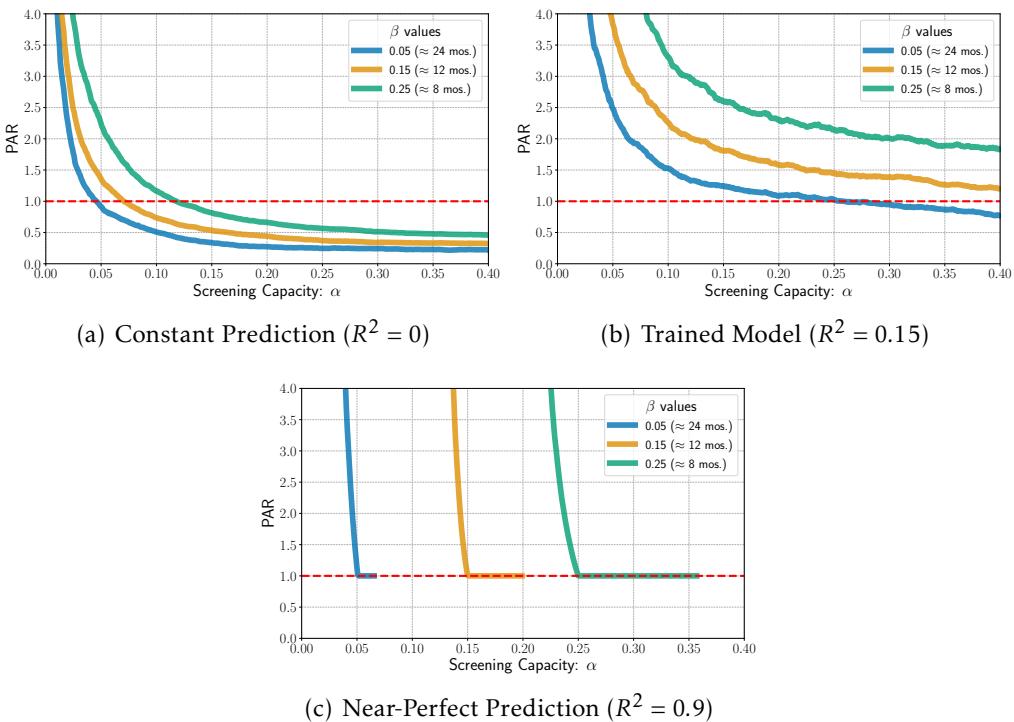
Figure 6 shows the PAR calculated on the real test data. Look at the orange line (which represents the 12-month unemployment target). The PAR is consistently above 1.0 (the red dashed line) for a wide range of screening capacities.
This confirms that for a typical social prediction system (where \(R^2\) is moderate), the marginal value of screening one additional person is higher than the marginal value of equivalent improvements in model accuracy.
Result 2: Simple vs. Complex Models
A common dilemma in government is whether to use a transparent, simple model (like a decision tree or a checklist) or a “black box” AI (like a neural network or gradient boosting). The black box is usually more accurate, but harder to explain and maintain.
The authors compared a simple 4-depth Decision Tree against the complex CatBoost model.
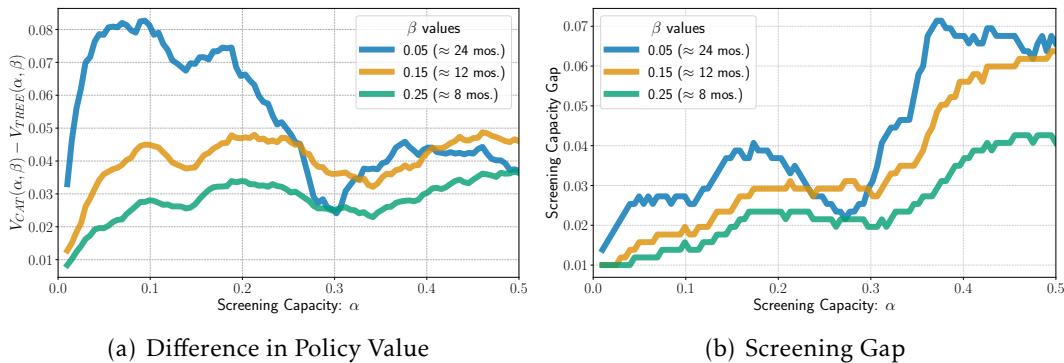
- Graph (a) shows the difference in policy value. The complex model (CatBoost) is better. It identifies more of the worst-off.
- Graph (b) is the game-changer. It asks: How much additional capacity would we need to give the Decision Tree system to match the performance of the CatBoost system?
The answer is surprisingly small—often just an increase of 0.05 to 0.07 in screening capacity.
This provides a concrete “price tag” for complexity. A policymaker can look at this and ask: “Is it cheaper to build, host, and explain a complex AI system, or is it cheaper to just hire enough staff to screen 5% more people using a simple checklist?” often, the latter is not only cheaper but more robust and transparent.
Conclusion: Don’t Forget the “Access” Lever
The seduction of AI in public policy is the promise of “optimization”—doing more with the same amount of resources. This paper throws cold water on that optimization fever. It reminds us that prediction is a means to an end, not the end itself.
Key Takeaways for Students and Practitioners:
- Context is King: You cannot evaluate a model’s worth by accuracy metrics alone (like MSE or AUC). You must evaluate it in the context of the allocation problem: Who are we trying to find, and how many people can we help?
- The Scarcity Trap: If your program is tiny (low \(\alpha\)), improving the model yields negligible returns compared to expanding the program.
- The Middle Ground: In the typical “messy middle” of social science predictions (\(R^2\) between 0.15 and 0.50), expanding access is usually the superior policy lever.
- Complexity has a Cost: Before deploying a state-of-the-art model, calculate the “access equivalent.” Could you achieve the same welfare outcome by using a simpler model and slightly expanding the budget?
By calculating the Prediction-Access Ratio, we can move the conversation from “how do we build better models?” to “how do we build better systems?"—systems that balance the intelligence of prediction with the compassion of expanded access.