](https://deep-paper.org/en/paper/2502.04313/images/cover.png)
Introduction
We are witnessing an era where Machine Learning models are improving at a breakneck pace. Scaling up training data and compute has birthed Large Language Models (LLMs) that can pass bar exams, write code, and solve complex logic puzzles. But as these models approach and potentially surpass human capability, we face a bottleneck: Evaluation.
How do we supervise a system that is smarter or faster than we are? Collecting high-quality human annotations is slow and expensive. The industry’s answer has been “AI Oversight”—using one AI to grade or teach another. We see this in “LLM-as-a-judge” leaderboards and “Weak-to-Strong” generalization experiments.
But there is a hidden danger in relying on AI to police AI.
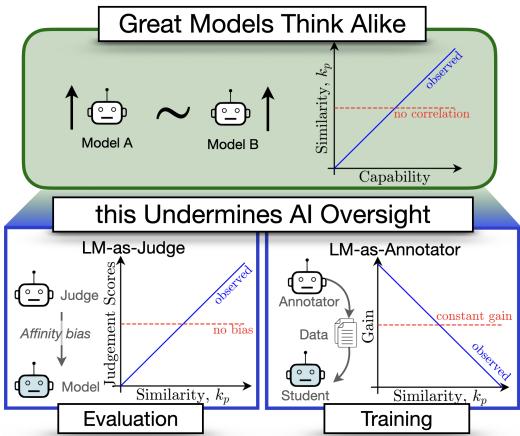
In a fascinating new paper titled Great Models Think Alike and this Undermines AI Oversight, researchers explore a critical question: Does the similarity between models affect how well they can supervise each other?
Their findings uncover a concerning paradox. Diversity is crucial for effective oversight, yet as models become more capable, their mistakes are becoming increasingly correlated. In this post, we will break down their novel metric for measuring model similarity, CAPA, and explore how “great minds thinking alike” might actually be a safety risk for the future of AI.
Part 1: How Do We Measure Model Similarity?
To understand if models are “thinking alike,” we first need a rigorous way to measure similarity. You might think we can just look at their weights or architecture, but that doesn’t tell us how they behave. Instead, the researchers focus on Functional Similarity—comparing the outputs models generate for the same inputs.
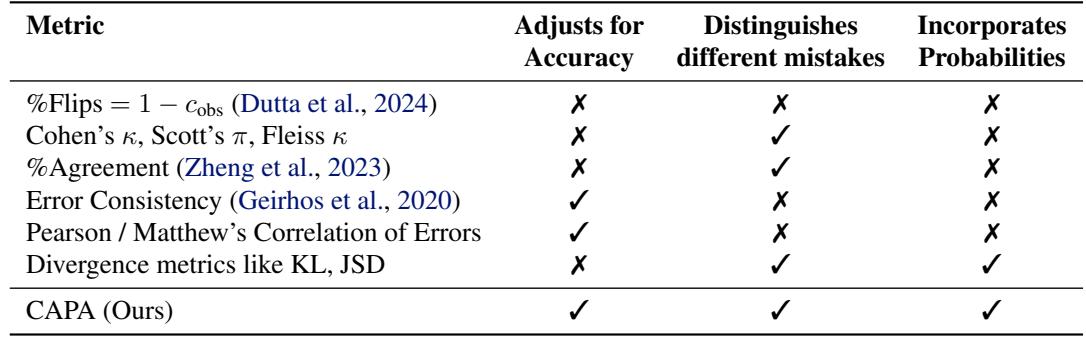
The Problem with Existing Metrics
A common approach is to look at Error Consistency. Simply put, if Model A and Model B both get a question wrong, do they choose the same wrong answer?
However, existing metrics have flaws when applied to LLMs:
- Inflation by Accuracy: Two smart models will agree often simply because they are both getting the right answer. We need to measure similarity beyond what is expected by their accuracy.
- Binary Limitations: Most metrics treat answers as right or wrong. But LLMs output probabilities. If Model A assigns 51% confidence to an answer and Model B assigns 49%, they are functionally similar, even if a binary metric sees a “flip.”
The researchers propose a new metric to solve this: Chance Adjusted Probabilistic Alignment (CAPA), denoted as \(\kappa_p\).
Introducing CAPA
CAPA is designed to satisfy three key requirements that previous metrics missed.
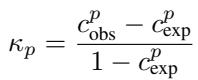
The mathematical foundation of CAPA extends standard agreement metrics (like Cohen’s Kappa). The general form for such metrics is:
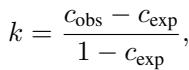
Where \(c_{obs}\) is the observed agreement and \(c_{exp}\) is the agreement expected by chance. CAPA innovates on how these two components are calculated.
1. Probabilistic Observed Agreement (\(c_{obs}^p\))
Instead of just checking if two models output the same text string, CAPA looks at the probability distributions over the options. It calculates the overlap (dot product) of the probabilities the two models assign to every option.
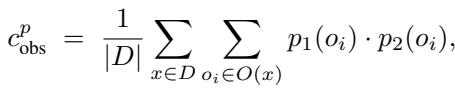
This captures nuance. If two models both assign high probability to the same incorrect option, this metric captures that “shared confusion” much better than a binary check.
2. Chance Agreement (\(c_{exp}^p\))
This is the most critical part of the derivation. We expect high-accuracy models to agree on the correct answer often. We want to measure how much they agree beyond that expectation.
The researchers define chance agreement by assuming two independent models. An independent model assigns probability to the correct answer based on its general accuracy (\(\bar{p}\)), and distributes the remaining probability uniformly among the incorrect options.

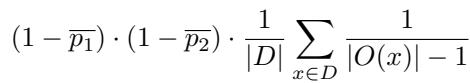
The formula effectively splits the calculation into two parts:
- Chance agreement on the correct option: Simply the product of their accuracies.
- Chance agreement on incorrect options: The probability that they both guessed wrong, normalized by the number of available options (assuming a uniform distribution of errors).
The Final Metric
Combining these gives us the final CAPA score:
A CAPA score of 0 means the models agree exactly as much as you’d expect two independent models to agree given their accuracies. A score approaching 1 means they are highly correlated—they make the same mistakes.
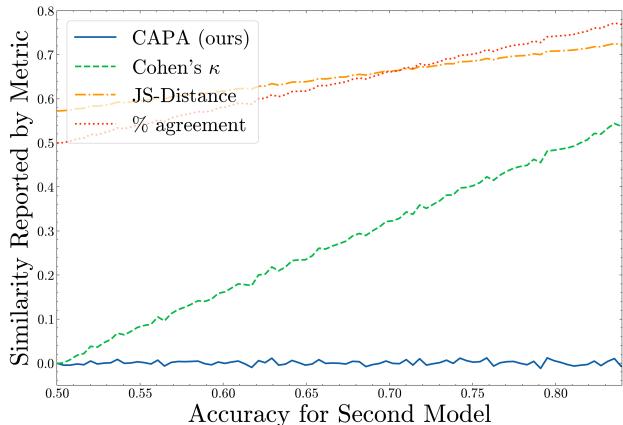
To prove this works, the authors ran a simulation. They took two independent models—meaning their errors were uncorrelated. As shown below, metrics like Cohen’s Kappa or simple % Agreement incorrectly rise as model accuracy improves. CAPA, however, correctly stays at 0, because the models are not functionally similar; they are just both getting smarter.
Part 2: The Narcissistic Judge (Evaluation)
Now that we have a robust ruler (CAPA), let’s measure something.
A popular trend in AI is “LLM-as-a-Judge.” Instead of paying humans to rate chatbot responses, we ask a strong model (like GPT-4 or Llama-3-70B) to rate them. The assumption is that a smart model is an objective judge.
The researchers tested this on the MMLU-Pro benchmark. They asked various “Judge” models to evaluate the answers of other models. They then compared the Judgment Score (how high the judge rated a model) against the Similarity (CAPA) between the judge and the model.
The Results: Affinity Bias
The results reveal a significant Affinity Bias. Judges systematically award higher scores to models that are functionally similar to themselves.
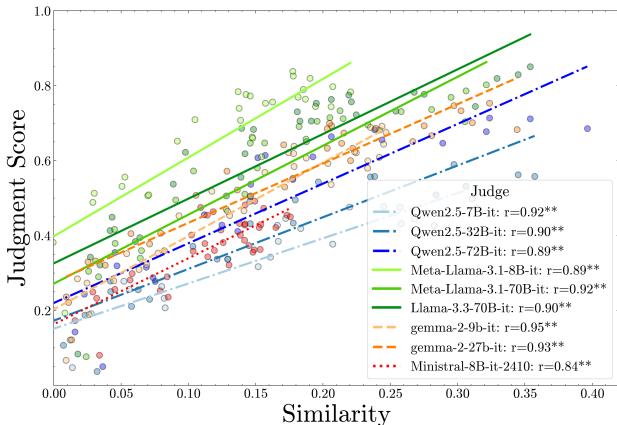
In the graph above, each line represents a different Judge model. You can see a clear upward trend: the more similar a model is to the judge (higher x-axis), the better score it gets (higher y-axis).
This isn’t just because similar models are smarter. The researchers used statistical controls (partial correlation analysis) to account for model accuracy. Even when you control for the fact that the models are capable, the bias remains. A judge essentially says, “You made the same mistake I would have made? That sounds correct to me!”
Why this matters: If we use GPT-4 to evaluate the next generation of models, and the next generation is trained to maximize that score, we might unknowingly breed models that share GPT-4’s blind spots rather than models that are objectively better.
Part 3: The Student and the Teacher (Training)
AI Oversight isn’t just about grading; it’s about teaching. A promising technique called Weak-to-Strong Generalization involves using a smaller, weaker model (the supervisor) to label data, which is then used to train a larger, stronger model (the student). Surprisingly, the strong student often outperforms the weak supervisor.
The researchers hypothesized that this works best when the student and supervisor have Complementary Knowledge. If the student already knows what the supervisor knows, the supervision is redundant.
Similarity vs. Performance Gain
To test this, they finetuned strong students on annotations from weak supervisors and measured the performance gain.
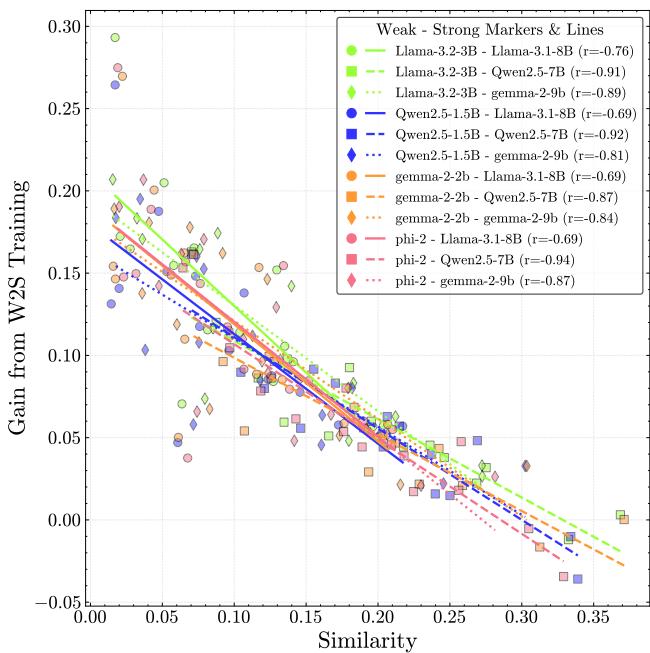
The correlation is striking (\(r = -0.85\)). The more different the models are (lower CAPA), the more the student learns.
When models are too similar, their errors overlap. The weak supervisor reinforces the strong student’s existing misconceptions. When they are different, the student can distinguish between the supervisor’s signal and its own priors, effectively “triangulating” the truth.
Elicitation vs. Complementary Knowledge
There is a debate about why weak-to-strong generalization works. Is it just Elicitation (unlocking knowledge the strong model already had buried inside)? or is it actual knowledge transfer?
The researchers decomposed the test data to find out.
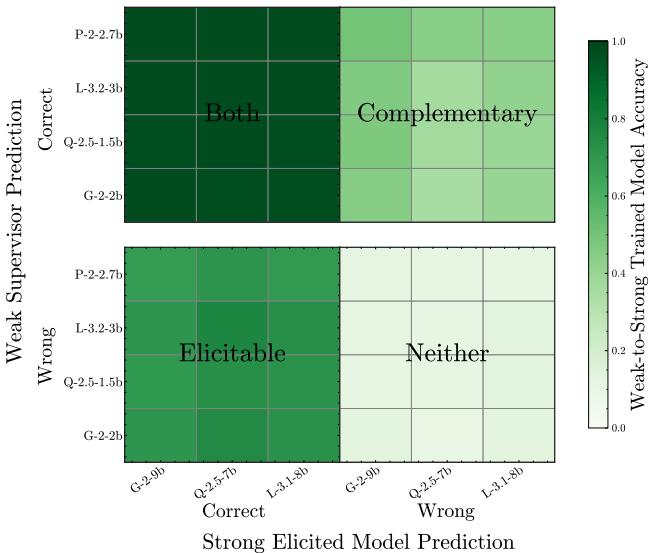
- Bottom-Left (Elicitation): The Weak Supervisor is Wrong, but the Student gets it Right. This is pure elicitation—the student ignored the bad label because it “knew better.”
- Top-Right (Complementary): The Strong Student (even when trained on ground truth) would get this wrong, but the Weak Supervisor gets it Right. This represents knowledge the student lacked but the supervisor had.
The data shows that both mechanisms are at play. Complementary knowledge transfer is a significant driver of performance. This implies that if we want to build super-intelligent models using weak supervision, we shouldn’t just look for accurate supervisors; we should look for diverse ones.
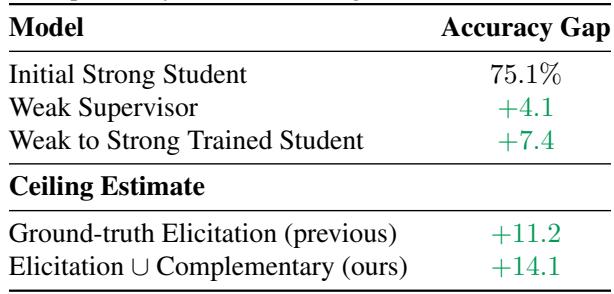
As shown in Table 3, accounting for complementary knowledge raises the potential “ceiling” of performance significantly higher than previously estimated.
Part 4: The Convergence Crisis
We have established two things:
- Low Similarity is good for judges (less bias).
- Low Similarity is good for training (higher learning gains).
Diversity is the fuel for effective AI Oversight. Now comes the bad news.
The researchers analyzed 130 models from the OpenLLM Leaderboard, ranging from small base models to massive instruct-tuned giants. They grouped them by capability (accuracy) and measured the average similarity (\(\kappa_p\)) within those groups.
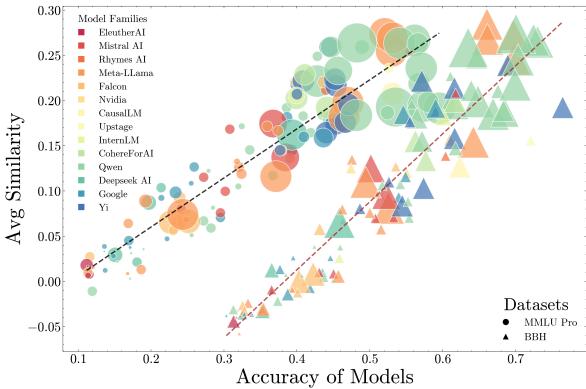
The trend is undeniable. As models become more capable, they are becoming more similar.
In the lower capability buckets (left side of the graph), models make different kinds of mistakes. They are “wrong in their own ways.” But as we move to the high-capability frontier (right side), models are converging. They are starting to share the same blind spots and failure modes.
The “Algorithmic Monoculture” Risk
This trend undermines the safety mechanisms we just discussed.
- For Evaluation: If top-tier models all think alike, using one to judge another will result in increasingly biased scores that mask shared errors.
- For Training: If the strong student and the weak supervisor are too similar, the gains from weak-to-strong generalization will diminish.
We risk entering a state of Algorithmic Monoculture, where distinct model families (Llama, Claude, GPT, Mistral) converge into a single “species” of intelligence with correlated risks. If one fails, they all fail.
Conclusion
The paper Great Models Think Alike provides a sobering look at the future of AI monitoring. While we celebrate the rising accuracy of LLMs, we must not ignore the convergence of their errors.
The introduction of CAPA gives the community a necessary tool. We need to move beyond just reporting “Accuracy” on leaderboards. We should be reporting “Similarity” and “Error Correlations.”
For AI Oversight to scale, we cannot rely on a single dominant model architecture or training data recipe. We need to actively cultivate model diversity. If we want AI to supervise AI safely, we need to ensure that when our models look in the mirror, they don’t just see a reflection of their own mistakes.
This blog post explains the research paper “Great Models Think Alike and this Undermines AI Oversight” by Goel et al. (2025).