](https://deep-paper.org/en/paper/2502.04879/images/cover.png)
Strength in Numbers: How Collectives Can Statistically Guarantee Influence on AI Platforms
In the modern digital ecosystem, the relationship between users and platforms is often viewed as a one-way street: the platform extracts data, trains algorithms, and dictates outcomes. But what happens when users band together?
Imagine a scenario where a group of gig economy workers wants to influence an algorithm to improve their wages, or a consumer advocacy group wants to prevent a recommendation system from promoting a specific, harmful product. This is the domain of Algorithmic Collective Action.
While the concept of manipulating algorithms (often called “data poisoning”) isn’t new, doing it effectively as a group involves significant risk. If you modify your data to protest, but the algorithm ignores you, you’ve incurred a cost for no reward. To make collective action viable, groups need a way to mathematically predict their success before they act.
In this post, we break down a fascinating paper titled “Statistical Collusion by Collectives on Learning Platforms.” The researchers develop a statistical framework that empowers collectives to estimate the exact amount of influence they can exert on a learning algorithm, effectively turning data poisoning from a dark art into a calculated science.
The Core Problem: Risk and Uncertainty
When a platform trains a machine learning model, it relies on the law of large numbers. It assumes that individual users are independent and that their data reflects a “ground truth.” A collective breaks this assumption by coordinating their behavior.
Previous research (such as Hardt et al., 2023) established that if a group is large enough, they can indeed control the platform. However, that research relied on the assumption of “infinite data”—an idealized world where we know the exact probability distributions of everything.
In the real world, collectives have finite data. They don’t know the exact internal workings of the platform’s algorithm, nor do they know the exact makeup of the rest of the population. They only have the data pooled by their members.
The goal of this paper is to bridge that gap. The researchers ask: How can a collective use their own limited data to design a strategy and guarantee its success with high probability?
The Setup: Platform vs. Collective
Let’s establish the players in this game.
- The Platform: Deploys a classifier (like a spam filter, a hiring bot, or a product rater). It trains on a dataset of size \(N\). It tries to minimize error based on the data it sees.
- The Population: A mix of regular users and the collective.
- The Collective: A group of size \(n\) (where \(n < N\)). They want to modify their data points \((x, y)\) using a strategy function \(h\) to achieve a specific goal.
The platform sees a mixture of “clean” data from regular users and “altered” data from the collective. It then updates its classifier \(\hat{f}\) based on this mixed distribution.
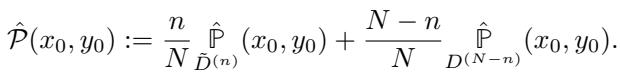
Here, \(\hat{\mathcal{P}}\) is the distribution the platform sees. It is a weighted average of the collective’s modified data (\(\tilde{D}^{(n)}\)) and the regular users’ data (\(D^{(N-n)}\)).
The collective’s power lies in the ratio \(n/N\). If they represent 0.01% of the user base, they are noise. If they represent 10%, they might be a signal. The challenge is determining exactly where the tipping point lies.
The Toolbox: Statistical Concentration
To predict success without knowing the full population distribution, the collective relies on Hoeffding’s Inequality.
In simple terms, Hoeffding’s Inequality allows us to bound the error between an observed average (from the collective’s data) and the true population average. The researchers define an error term, \(R_\delta(k)\), which shrinks as the amount of data \(k\) grows.
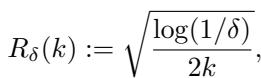
This little equation is the engine of the paper. It tells the collective: “Based on the \(n\) members you have, your estimate of the world is accurate within \(\pm R_\delta(n)\).” This error term is what makes the guarantees “statistical”—they hold with high probability (at least \(1-\delta\)).
Objective 1: Signal Planting
The most direct form of influence is Signal Planting. The collective wants the platform to learn a specific rule: “Whenever you see feature \(X\), predict label \(Y^*\).”
For example, a group of users might want to force an algorithm to rate a specific type of car (say, SUVs) as “Poor,” regardless of its actual safety features.
The Strategy
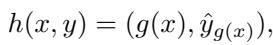
The collective employs a Feature-Label Strategy. For every member in the collective, they modify the data point to have the target feature (the “signal”) and the target label.
\[h(x, y) = (g(x), y^*)\]where \(g(x)\) transforms the feature (e.g., changes “Sedan” to “SUV”) and \(y^*\) is the desired label (e.g., “Poor”).
The Guarantee
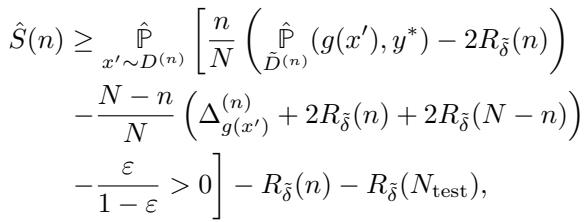
How do they know if it will work? The researchers derived a Lower Bound on Success. This inequality allows the collective to plug in their numbers and see if they will win.
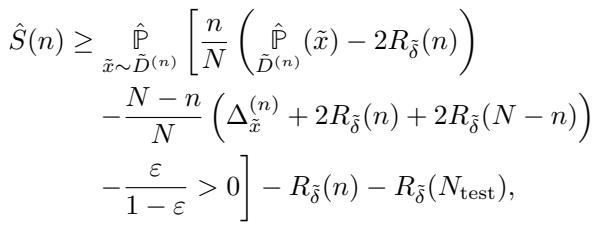
This formula might look intimidating, but let’s break it down into a story of Influence vs. Resistance:
- The Collective’s Push (First Term): \(\frac{n}{N} (\dots)\). This represents the strength of the collective. It scales with the size of the group (\(n\)). The more members effectively planting the signal, the higher this value.
- The Population’s Resistance (Second Term): \(- \frac{N-n}{N} (\dots)\). This represents the “clean” data fighting back. If the rest of the population strongly associates the signal with a different label, this term is large, making success harder.
- The “Safety Margin” (\(R_\delta\) terms): Notice the minus signs before the \(R_\delta\) terms. Because the collective relies on finite samples, they must be conservative. They subtract the potential statistical error to ensure their prediction holds true in the worst-case scenario.
If the result of this equation is greater than 0, the collective effectively “wins”—the platform will likely adopt the planted rule.
Feature-Only Strategy
Sometimes, users can’t change the label (e.g., in a loan application, the outcome “defaulted” or “paid back” might be fixed). They can only change their features. The paper provides a modified bound for this, though it is naturally weaker since the collective has less leverage.
Objective 2: Signal Unplanting
Sometimes the goal isn’t to force a specific outcome, but to break an existing association. This is Signal Unplanting.
Imagine an algorithm that unfairly correlates a specific zip code with “High Credit Risk.” The collective doesn’t necessarily want to force the label “Low Risk” (which might look suspicious); they just want to stop the algorithm from defaulting to “High Risk.”
The “Naive” vs. “Adaptive” Strategy
A naive approach would be to just spam a single different label. But a smarter, adaptive strategy creates more chaos for the model.
The collective splits its members. It uses a small sub-group (\(n_e\)) to analyze the data and estimate: What is the most likely label that isn’t the one we want to hide?
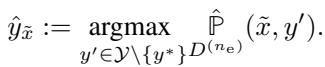
Once they identify this “second best” label (\(\hat{y}\)), the rest of the collective switches their data to that label.
This is clever because it leverages the natural distribution of the data. It pushes the model toward a conclusion that is already plausible, making the “unplanting” much more efficient than trying to force a completely unnatural label.
Objective 3: Signal Erasing
The final objective is the most subtle: Signal Erasing. Here, the collective wants the platform to become invariant to a change. If I change my hair color in a photo, the facial recognition system should still recognize me. If the system is biased against a certain change, the collective acts to erase that bias.
The goal is to ensure that the model’s prediction for the modified feature \(g(x)\) is the same as for the original \(x\).
To achieve this, the collective essentially “fills in the gaps.” They look at the distribution of labels for the modified features and strategically inject data to make the conditional probability distribution look identical to the original features. This requires a much larger collective size because estimating the full distribution (to match it) is statistically expensive.
Experimental Results: The “Staircase” of Influence
The researchers validated these bounds using a synthetic car evaluation dataset. They simulated a collective trying to influence a car rating platform. The results revealed distinct patterns in how influence scales.
1. The S-Curve and the Staircase
In the infinite data limits of previous research, influence curves looked like smooth Sigmoid (S-shaped) functions. However, with finite, discrete data, the researchers found a staircase pattern.
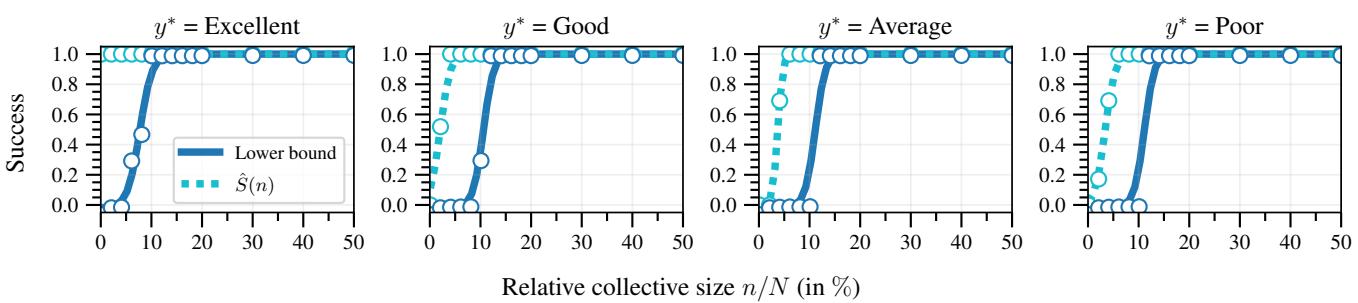
Look at the plot above.
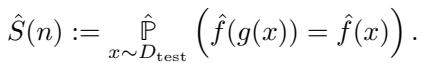
- The Dashed Line (\(\hat{S}(n)\)): This is the actual success rate. Notice it stays at 0 for a while, then shoots up. This indicates that small collectives have almost no influence until they reach a “tipping point” where they overcome the population’s resistance.
- The Solid Line (Lower Bound): This is the conservative estimate calculated by the collective. It closely tracks the real success but stays slightly underneath it. This proves the framework works: the collective can safely trust this calculation.
2. Absolute Size Matters
One of the most profound insights of this paper is that relative size (\(n/N\)) is not enough.
If a collective represents 10% of the population, are they powerful?
- If \(N=1,000\) and \(n=100\), their statistical error (\(R_\delta\)) is high. Their estimate is fuzzy.
- If \(N=1,000,000\) and \(n=100,000\), their error is tiny.
Larger platforms are actually more vulnerable to collective action because the collective acts with higher statistical precision.
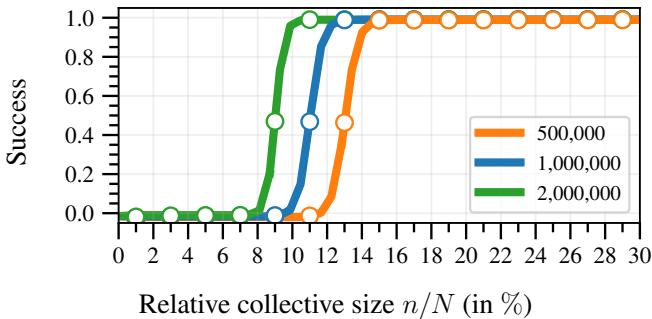
In Figure 2, you can see that for the same relative percentage (x-axis), the curve becomes steeper and shifts left as \(N\) increases (Green vs. Orange lines). A collective of 100,000 users on a massive platform is more effective than a collective of 100 users on a tiny platform, even if they both represent 10% of the user base.
3. Adaptive Unplanting Wins
The experiments also showed that the adaptive strategy for unplanting (estimating the next-best label) vastly outperforms naive strategies.
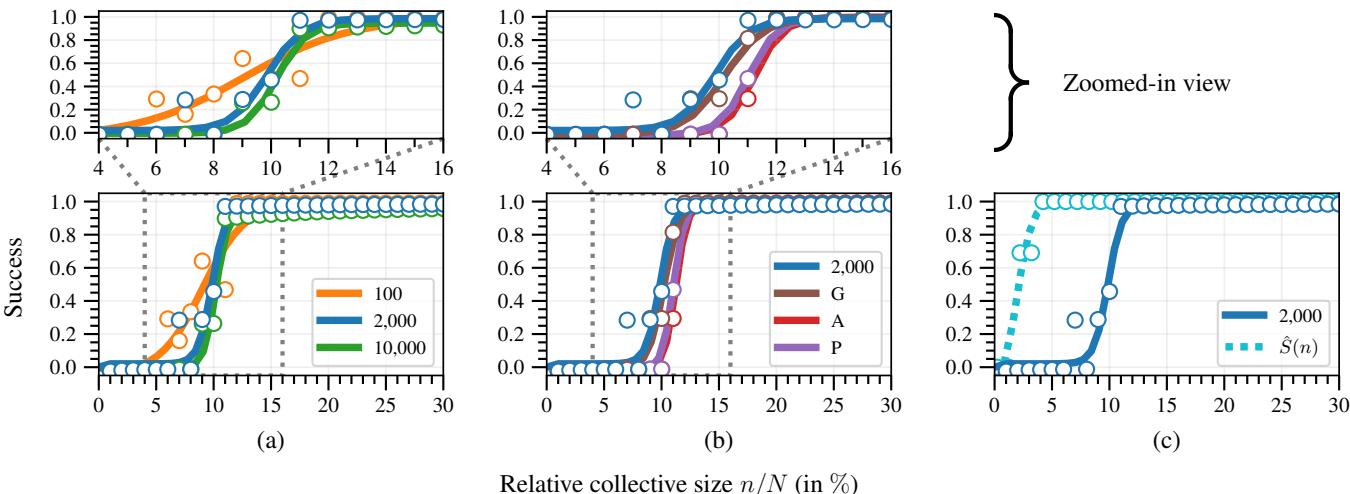
In Figure 3(b), the Adaptive strategy (blue) achieves success with a smaller collective size than naive strategies (planting “Good”, “Average”, or “Poor” blindly). Figure 3(a) also highlights the trade-off: if you use too many members to estimate the strategy (\(n_e\)), you don’t have enough members left to execute it. There is a sweet spot.
Conclusion: The Future of Digital Unions
This research shifts the narrative of adversarial machine learning. It moves away from the idea of “attacks” by malicious hackers and toward the idea of “negotiation” by coordinated users.
By providing a statistical framework, the authors have shown that collectives don’t need to shoot in the dark. They can:
- Pool their data.
- Calculate the specific “resistance” of the feature they want to change.
- Compute the exact number of members needed to overcome that resistance.
- Execute the strike with a statistical guarantee of success.
The implications are significant. As platforms grow larger, they become statistically more stable, but also more susceptible to large, coordinated groups who can estimate the platform’s behavior with high precision. This paper provides the mathematical blueprint for the digital unions of the future.