](https://deep-paper.org/en/paper/8317_scaling_trends_in_languag-1757/images/cover.png)
The Arms Race of AI: Does Scale Automatically Fix Robustness?
The rapid ascent of Large Language Models (LLMs) has been defined by a single, powerful concept: scaling laws. We have learned, quite empirically, that adding more parameters, more data, and more compute consistently unlocks new capabilities. From writing code to passing the bar exam, “bigger is better” has been the golden rule of the AI boom.
But there is a shadow side to this growth. While models become more capable, they remain stubbornly vulnerable to adversarial attacks. “Jailbreaks”—prompts designed to trick models into generating harmful content—plague even the most advanced systems (like GPT-4 or Claude). As models are integrated into critical systems, from email filtering to autonomous agents, these vulnerabilities transform from curiosities into security risks.
This leads to a critical question that has remained largely unanswered until now: Does the “bigger is better” rule apply to safety? As we scale up models, do they naturally become more robust against attacks, or do they simply become smarter targets?
In this post, we dive deep into a comprehensive study titled “Scaling Trends in Language Model Robustness.” The researchers conducted a massive empirical investigation across model families (Pythia and Qwen2.5), varying sizes (from 7 million to 14 billion parameters), and attack strategies. Their findings paint a complex picture of an ongoing arms race between attackers and defenders, where compute is the ammunition and scale is the battlefield.
The Scaling Lens
To understand the future of AI safety, we cannot just look at a snapshot of current models. We must look at the trends. This is what the authors call the “scaling lens.”
In standard capability research, we expect smooth power-law curves: double the compute, get a predictable drop in loss. The researchers applied this same rigorous mathematical lens to robustness. They asked:
- Attack Scaling: If an attacker doubles their compute (runs an attack longer), how much does their success rate increase?
- Defense Scaling: If a defender doubles their compute (trains on more adversarial examples), how much does the model’s robustness improve?
- Model Scaling: If we just make the model bigger, does it get safer?
To answer these questions scientifically, the researchers moved away from vague “chatbot” evaluations (which are hard to grade) and focused on classification tasks.
The Setup: Transforming LLMs into Classifiers
Evaluating whether a model “refused” a harmful prompt is often subjective. To get hard numbers, the researchers fine-tuned LLMs on standard classification tasks, such as:
- Spam Detection: Is this email spam or ham?
- Sentiment Analysis (IMDB): Is this movie review positive or negative?
- Synthetic Tasks: Like “PasswordMatch” (do two strings match?) or “WordLength” (which word is longer?).
By forcing the LLM to output a specific class (e.g., “SPAM”), the researchers could run precise adversarial attacks. An attack is considered successful if it forces the model to misclassify an example it previously got right.
The study used two main model families:
- Pythia: A suite of models ranging from 14M to 12B parameters, designed specifically for scaling research.
- Qwen2.5: A frontier model family ranging from 0.5B to 14B parameters.
Part 1: The Myth of Passive Robustness
The first major finding of the paper challenges a common assumption. You might think that a 12 billion parameter model, having read significantly more text and possessing a deeper understanding of language, would be naturally harder to trick than a tiny 14 million parameter model.
It turns out, scale alone is not a shield.
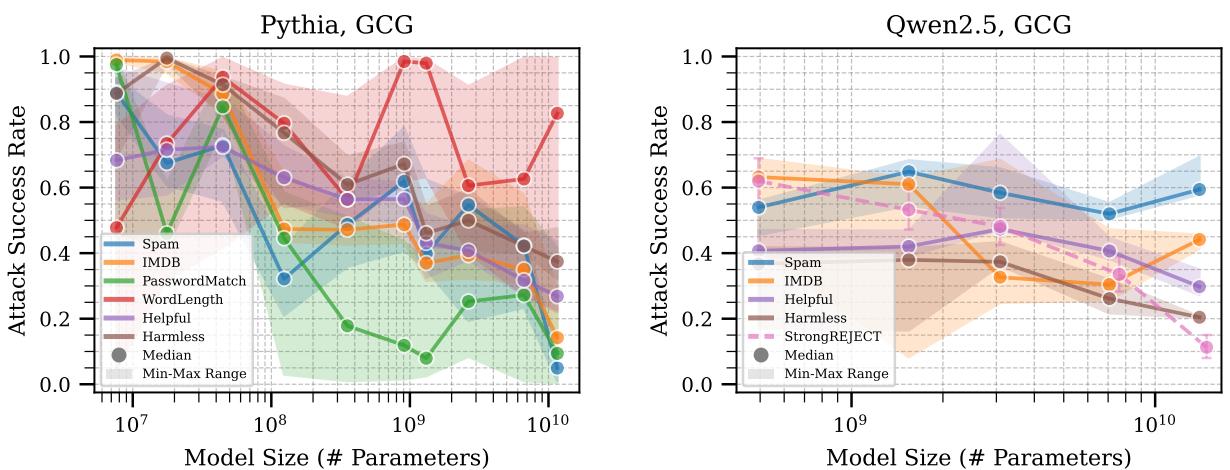
Take a close look at Figure 2 above. The charts plot Attack Success Rate (y-axis) against Model Size (x-axis).
- Left Panel (Pythia): Look at the blue line (Spam task). As the model gets bigger (moving right), the attack success rate actually increases in some areas before dipping. On the WordLength task (red line), model size seems almost irrelevant to robustness.
- Right Panel (Qwen2.5): The trends are flatter. While massive scale (far right) helps slightly, there is no guarantee that a bigger model is safer.
The takeaway: In the absence of explicit safety training, simply making a model larger does not consistently make it more robust. In some cases, larger models might even be easier to attack because they follow instructions (even malicious ones) more faithfully.
The Attacker’s Advantage: Compute is King
If model size doesn’t guarantee safety, what guarantees a successful attack? Compute.
The researchers tested several attack methods, including GCG (Greedy Coordinate Gradient). GCG is an optimization method that finds a sequence of “gibberish” characters (an adversarial suffix) that, when added to a prompt, forces the model to output a specific target.
The study found that attack success scales smoothly with the amount of compute thrown at it.
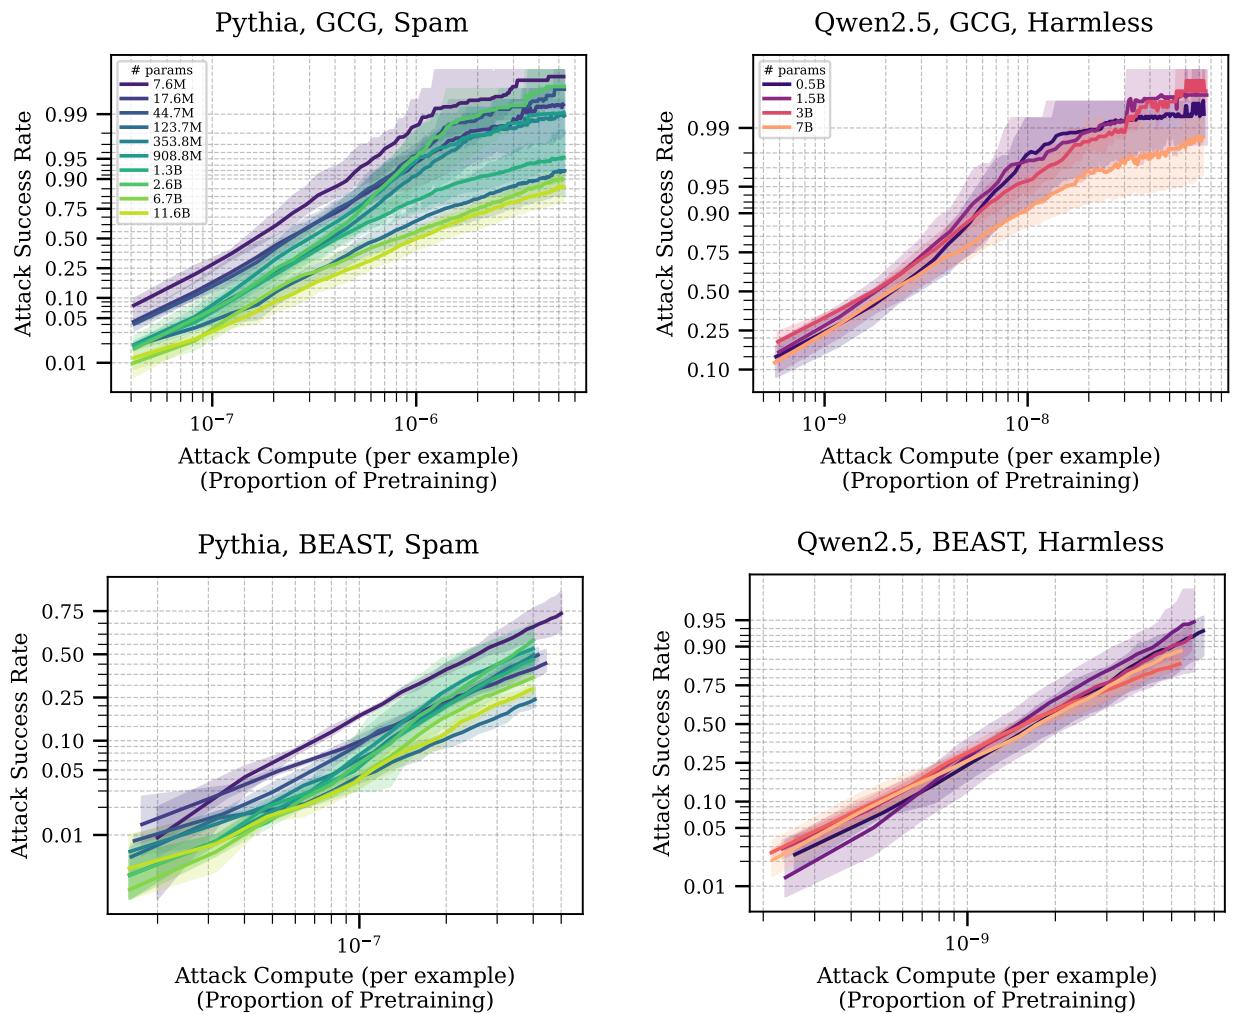
In Figure 3, we see the relationship between the attacker’s effort (compute spent) and their success.
- The x-axis represents the compute cost of the attack (relative to pretraining).
- The y-axis is the Attack Success Rate (ASR).
Notice the consistent upward trend. Regardless of the model size (the different colored lines), if an attacker is willing to spend more FLOPs (floating point operations) running their optimization algorithm longer, they will eventually break the model.
Interestingly, looking at the Qwen2.5 plot (right), the lines for different model sizes are clumped together. This reinforces the previous point: against a determined attacker with compute, a 7B parameter model isn’t necessarily much harder to break than a 0.5B parameter model.
Part 2: The Defender Strikes Back (Adversarial Training)
Passive robustness failed. So, what happens when we actively try to defend the models?
The gold standard for defense is Adversarial Training. This is an iterative process where you:
- Take a model.
- Attack it to generate adversarial examples (data that tricks it).
- Train the model on those examples to recognize the trick.
- Repeat.
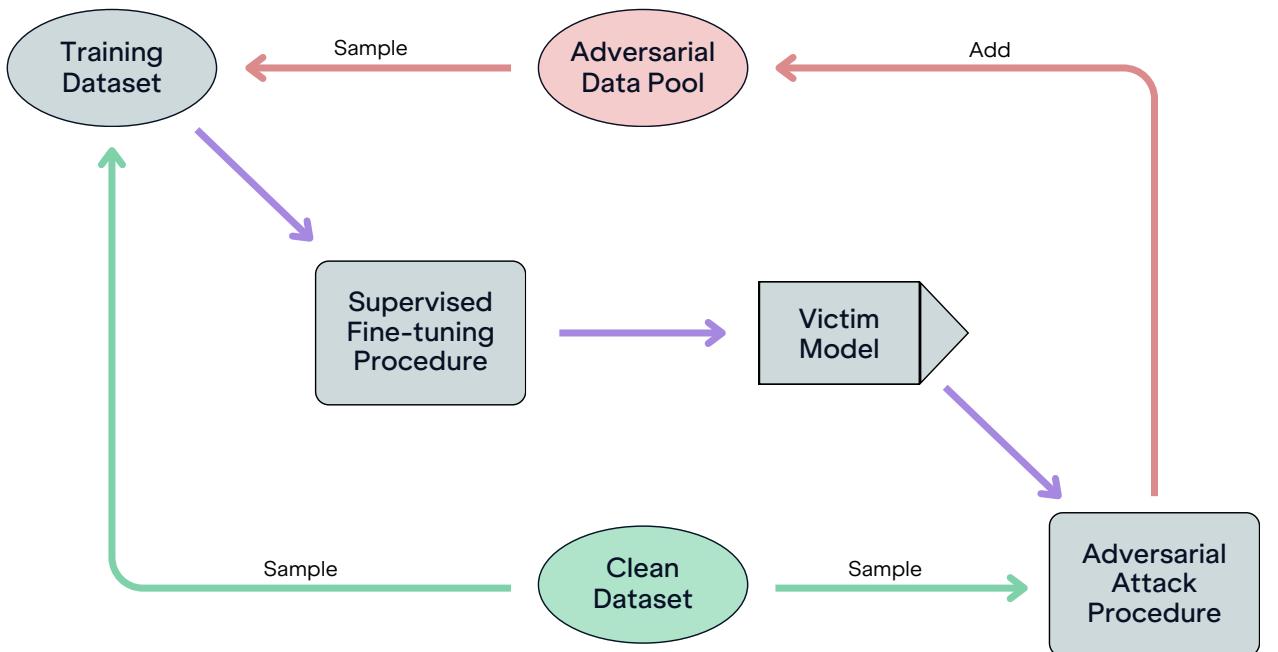
The researchers implemented the loop shown in Figure 26. They maintained a growing pool of adversarial data, mixing it with clean data to fine-tune the victim models.
Sample Efficiency vs. Compute Efficiency
Here is where the scaling behavior gets fascinating. How does model size affect the learning of defense?
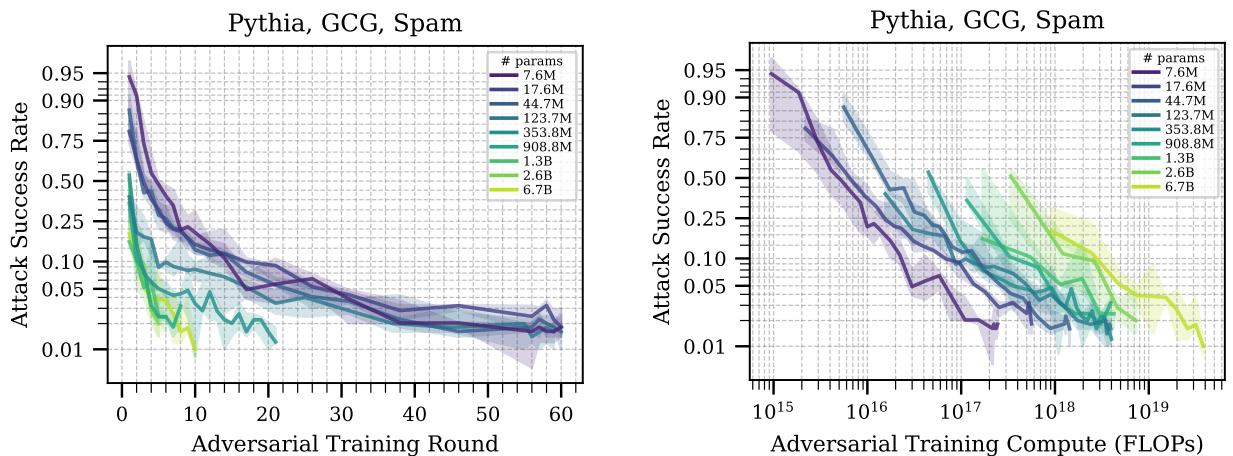
Figure 5 reveals a crucial trade-off:
- Sample Efficiency (Left Plot): The x-axis is “Training Rounds.” The larger models (lighter/yellow lines) drop their attack success rate much faster than smaller models (dark/purple lines). This means large models are “smarter”—they learn to defend themselves using fewer examples. They generalize the concept of “don’t be tricked” faster.
- Compute Efficiency (Right Plot): The x-axis is “Compute (FLOPs).” Here, the curves flip or cluster. Because a large model is so expensive to run, even though it learns in fewer steps, it costs significantly more compute to achieve the same level of safety.
For a defender with a limited budget, a smaller model is actually cheaper to secure. But for a defender prioritizing maximum safety regardless of cost, the larger model learns the lesson more thoroughly.
Part 3: The Offense-Defense Balance
We have established that both attackers and defenders benefit from scaling compute.
- Attackers spend compute to find better jailbreaks.
- Defenders spend compute on adversarial training to patch holes.
This creates a dynamic adversarial game. Who has the advantage?
To answer this, the researchers combined their data into a single, powerful visualization comparing attack cost vs. defense cost.
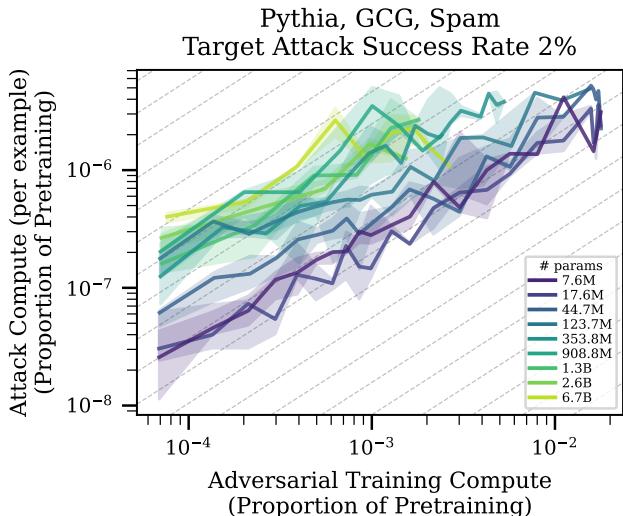
Figure 1 is arguably the most important chart in the paper. It plots:
- X-axis: Defense Compute (how much effort was put into adversarial training).
- Y-axis: Attack Compute (how much effort is needed to break the model 2% of the time).
Interpreting the Slope: The dashed grey lines represent a slope of 1. If the data followed this line, it would mean that for every doubling of defense spending, the attacker must also double their spending to break in. This would be a stalemate.
The Reality: The colored lines generally have a slope less than 1. This is bad news for defenders. It means that if the defender doubles their budget, the attacker needs to increase their budget by less than double to maintain their success. In the current regime, offense scales better than defense. It is cheaper to destroy than to build.
The Hope (The Intercept): However, look at the position of the lines. The lines for larger models (lighter colors) are higher up and further to the left. This means that while the rate favors the attacker, the absolute cost to break a large, adversarially trained model is much higher.
If these trends continue—if the curves keep shifting “up and to the left” as models grow to 100B or 1T parameters—we might reach a crossover point. Eventually, the initial cost to break a frontier model might become so astronomically high that it becomes infeasible for attackers, even if the scaling slope theoretically favors them.
Robustness Transfer: The Hidden Strength of Scale
There is one final glimmer of hope for large models: Generalization.
In the real world, defenders don’t know exactly what attack method will be used against them. They train on Attack A, but hackers might use Attack B.
The researchers tested this by training models to defend against the GCG attack, but then evaluating them against a different attack called BEAST, and against different threat models (like putting the attack string in the middle of the prompt rather than the end).
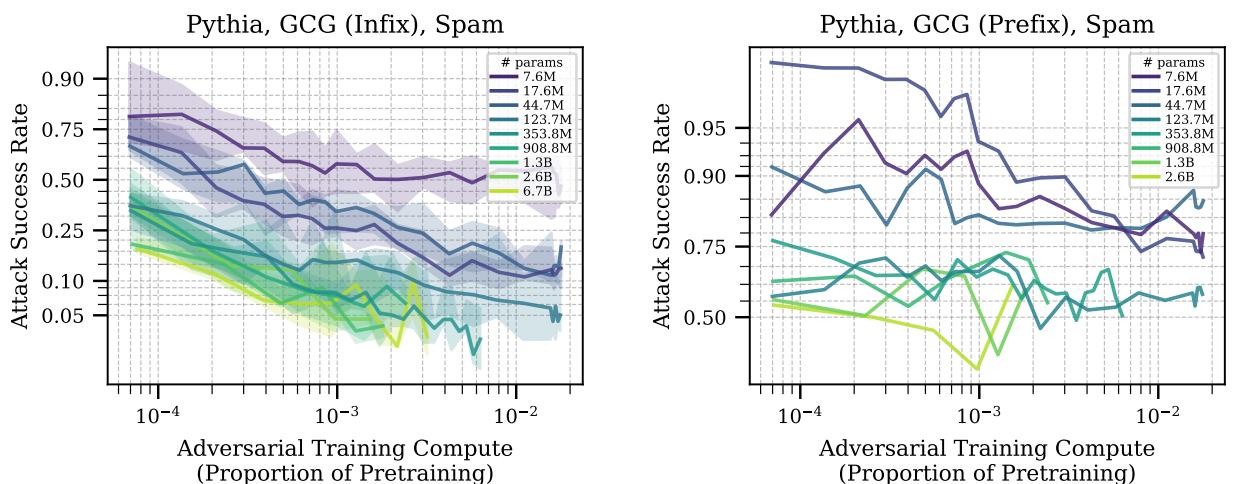
Figure 7 shows the results of this transfer.
- Left (Infix Attack): The adversarial training (done on suffix attacks) transfers reasonably well to “infix” attacks (inserted in the middle). Crucially, larger models (lighter lines) transfer better. Their curves drop lower, meaning they are better at applying the defense to a slightly different situation.
- Right (Prefix Attack): When the attack is moved to the start of the prompt (prefix), the transfer fails for almost everyone. This is “out of distribution.”
However, looking at transfer between attack algorithms (e.g., training on GCG and testing on BEAST) generally showed that defense does transfer, and larger models often possess a superior ability to generalize their safety training to unseen attacks.
Conclusion: The Long Game
The paper “Scaling Trends in Language Model Robustness” provides a sober, data-driven look at AI safety. It dispels the magical thinking that scale alone fixes security flaws.
Here are the key takeaways for students and practitioners:
- No Free Lunch: You cannot simply train a bigger model and expect it to be safe. Without specific defensive training, a 14B parameter model is just as vulnerable as a 0.5B one.
- The Arms Race favors Offense (for now): Currently, it is more compute-efficient to attack a model than to defend it. As compute becomes cheaper, attackers gain an edge.
- Scale is the Defender’s Hope: Despite the attacker’s advantage, scale changes the playing field. Larger models are more sample-efficient learners and generalize their defenses better.
The authors conclude with a nuanced perspective. While the slope of the scaling curves currently favors the attacker, the sheer magnitude of defense that larger models can support might eventually tip the scales. If we continue to scale model size and adversarial training simultaneously, we may eventually produce models where the cost of a successful attack exceeds the resources of any reasonable adversary.
Until then, the game of cat and mouse continues—and compute is the currency of the realm.