](https://deep-paper.org/en/paper/file-3327/images/cover.png)
In the age of information overload, verifying a single claim often feels like detective work. You read a headline, check a news article, watch a video clip, and perhaps look at a photo caption. Rarely does a single document hold all the answers. Yet, most automated fact-checking systems today operate in a bubble: they look at a single piece of text and output a binary “True” or “False.”
But misinformation is rarely black and white. A claim might be mostly true but contain a fabricated statistic. Or, it might describe a real event but attribute it to the wrong location shown in a video. To build trust, AI needs to do more than just flag a post; it needs to explain exactly which part of the claim contradicts the evidence.
This brings us to M3D, a novel framework introduced in a recent research paper that tackles MultiModal, MultiDocument, fine-grained inconsistency detection. This post explores how researchers created a system capable of parsing text, images, video, and audio to pinpoint specific logical errors within complex claims.
The Problem: The “Black Box” of Fact-Checking
Current state-of-the-art misinformation detection faces three distinct limitations:
- Single-Source Bias: Most models assume all evidence comes from one document. In reality, verifying a breaking news event often requires synthesizing a video report, an eyewitness audio clip, and written articles.
- The “Neutral” Blind Spot: Existing models struggle with ambiguity. If a claim cannot be verified by the evidence, models often force a “False” prediction rather than admitting “Neutral” (not enough information).
- Lack of Granularity: Flagging a complex sentence as “False” is unhelpful. Users need to know which specific entity, action, or relationship is incorrect.
The M3D approach proposes a solution: predicting the logical relationship (entailed, neutral, or contradicted) for each piece of a claim against a set of multimodal sources.
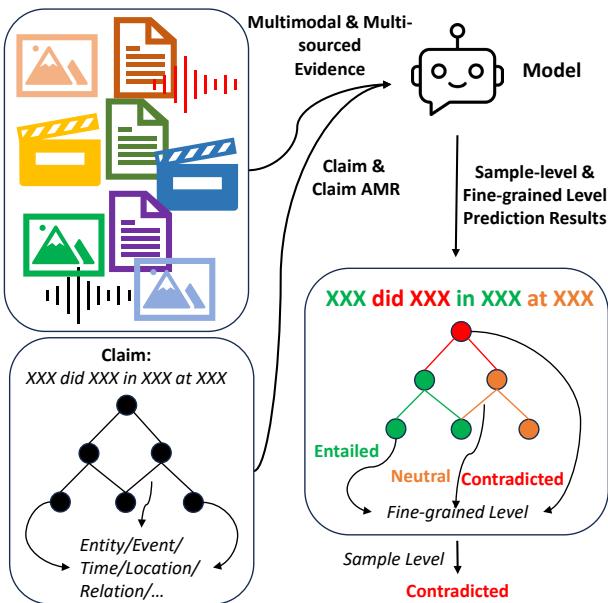
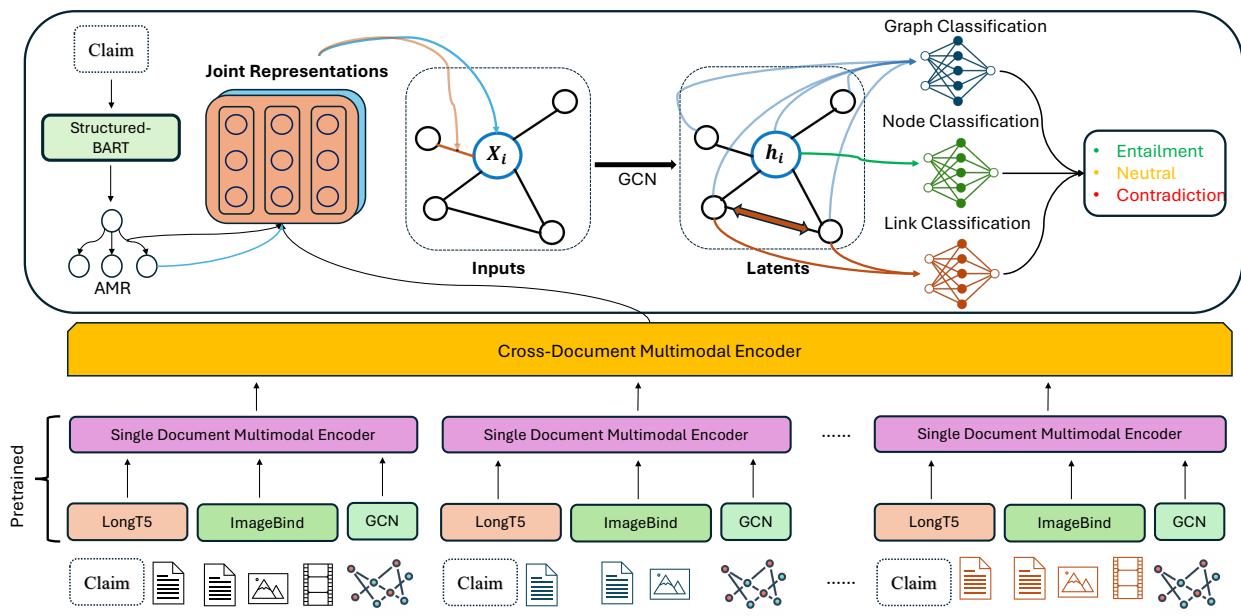
As shown in Figure 1, the goal is to take a claim and break it down into a semantic graph. The model then checks every node (object/entity) and tuple (relation) against the evidence, resulting in a detailed map of truthfulness.
The Foundation: Building the M3DC Dataset
One of the biggest hurdles in training granular fact-checking models is the lack of data. There simply wasn’t a dataset that provided fine-grained labels for claims requiring cross-document, multimodal reasoning. The researchers solved this by synthesizing their own benchmark, called M3DC.
Step 1: Constructing Multimodal Knowledge Graphs
The process begins with “NewsStories,” a collection of news clusters containing articles, images, and videos. The researchers didn’t just dump this data into a model; they structured it using Abstract Meaning Representation (AMR).
AMR captures the logic of a sentence (who did what to whom) as a graph. By extracting AMR trees from text, image captions, and video summaries, and then linking them using co-reference resolution (figuring out that “the fire” in the text is the same as the “flames” in the video), they built a unified Knowledge Graph (KG).
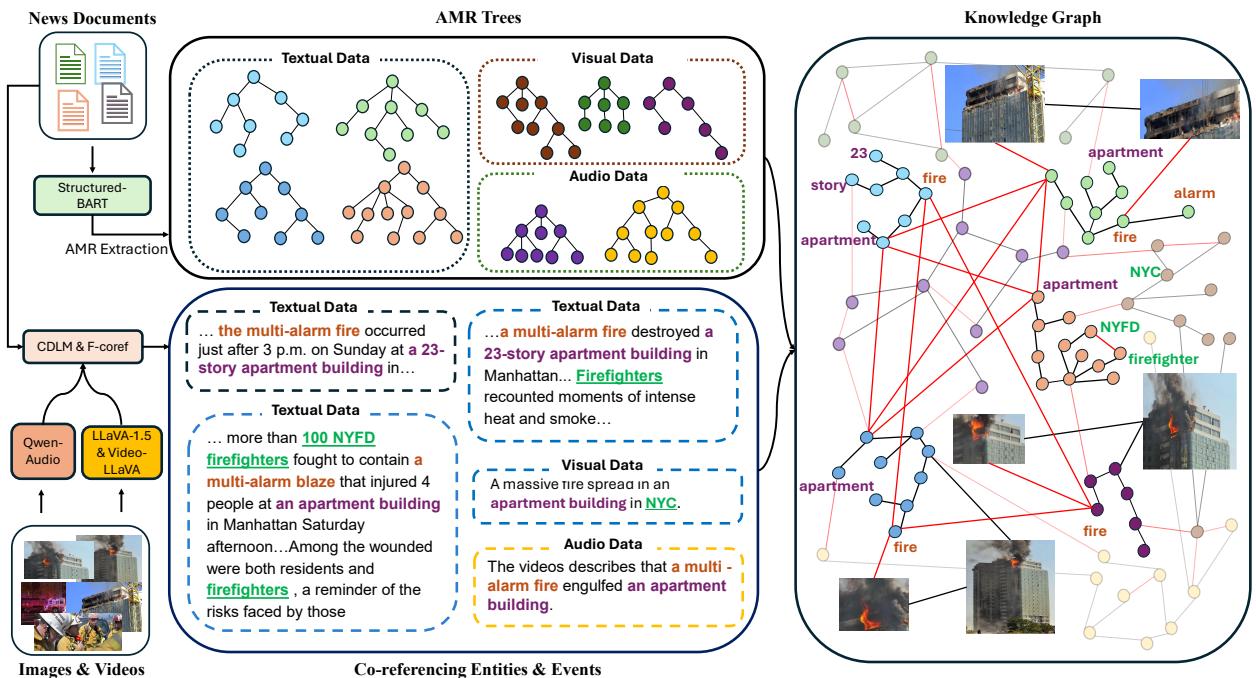
Figure 2 illustrates this construction. Notice how textual data, visual data (processed by LLaVA), and audio data (processed by Qwen-Audio) converge. This cross-media graph serves as the “ground truth” for the event.
Step 2: Generating and Manipulating Claims
With a robust Knowledge Graph in hand, the next step is generating claims to train the model.
- Traversing the Graph: The system walks through the KG to select connected facts (Knowledge Elements) and uses a language model to generate a True (Entailed) claim.
- Claim Manipulation: This is the clever part. To teach the model to spot lies and ambiguity, the researchers used a “Claim Manipulator” model. This model takes the true claim and evidence, then perturbs the claim to make it Neutral or Contradicted.
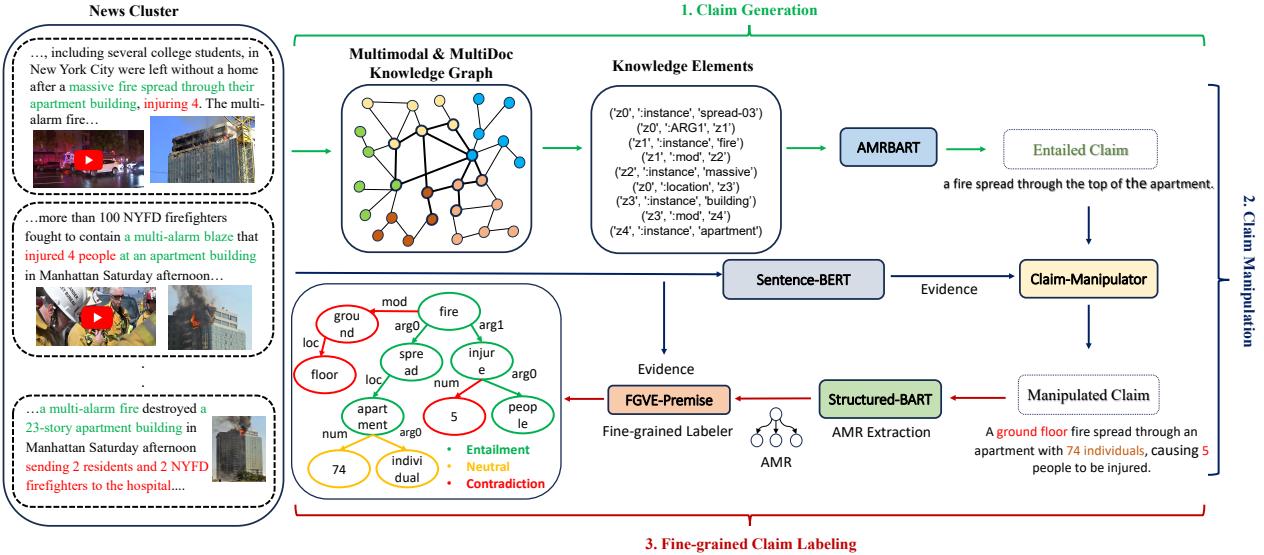
As seen in Figure 3, the manipulator might change “fire spread through the top” to “fire spread through the ground floor” (Contradiction) or add unverified details like “74 individuals” (Neutral).
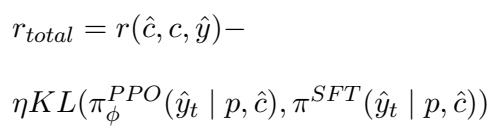
To ensure high-quality manipulations, the researchers trained the manipulator using Reinforcement Learning (RL). They used a reward function that balances three goals:
- Achieving the target label (e.g., forcing a contradiction).
- Keeping the text similar to the original claim (using ROUGE scores).
- Maintaining logical consistency.
The reward function is defined mathematically as:
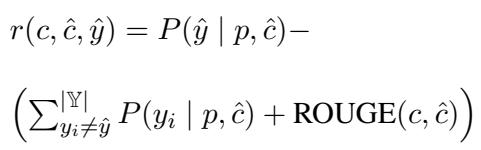
Here, the model is rewarded if the generated claim \(\hat{c}\) matches the target label \(\hat{y}\) while remaining textually close to the original claim \(c\). To prevent the RL model from drifting too far from fluent language, they used Proximal Policy Optimization (PPO) with a KL-divergence penalty:
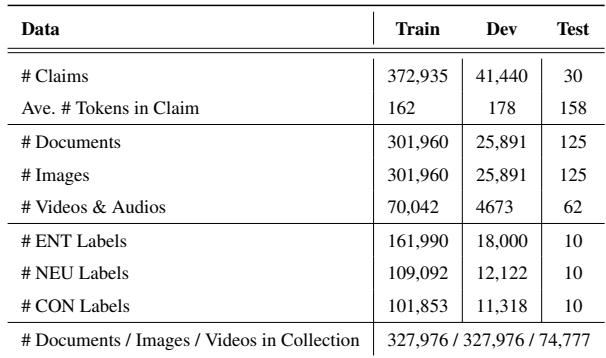
This rigorous process resulted in a massive dataset. Table 1 (below) highlights how M3DC compares to existing datasets—it is the only one offering fine-grained labels in a multimodal, multi-document setting.
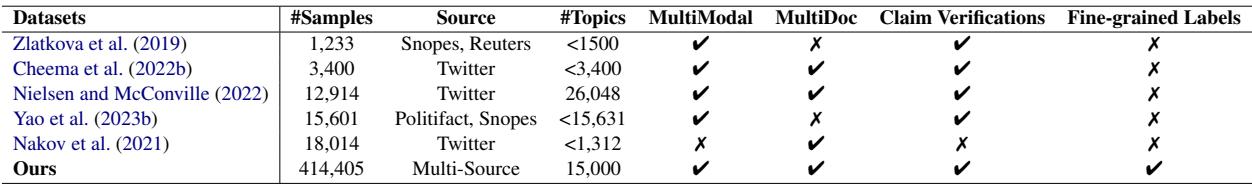
The scale of the dataset is impressive, covering over 400,000 claims across 15,000 topics.
The M3D Model Architecture
How does one build a neural network that can “read” a graph of text and “watch” a video simultaneously? The M3D model uses a hierarchical approach, combining multimodal encoders with Graph Convolutional Networks (GCNs).
1. Multimodal Encoding
The model preserves the context of the evidence.
- Text: Encoded using LongT5, capable of handling long sequences of text across multiple documents.
- Visual/Audio: Encoded using ImageBind, which maps images, video, and audio into a shared embedding space.
- Knowledge Graph: The cluster-specific KG is encoded using a GCN.
These representations are concatenated to form a rich, joint representation of the evidence.
2. Graph Reasoning
The core reasoning happens over the claim’s AMR graph. The model initializes the graph nodes with the multimodal features and then updates them using a GCN. This allows information to propagate through the logical structure of the claim.
The node feature update rule is:
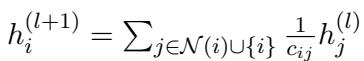
This equation essentially says that a node’s understanding (\(h_i\)) is updated by averaging the features of its neighbors (\(h_j\)).
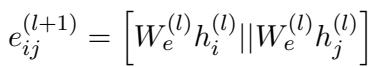
Crucially, the model also updates edge features, recognizing that the relationship between two words (e.g., “caused by”) is just as important as the words themselves.
3. Prediction
Finally, the model uses these enriched graph features to make predictions at two levels:
- Sample-Level: Is the whole claim True, False, or Neutral?
- Fine-Grained: Is this specific node or edge Entailed, Contradicted, or Neutral?
Experimental Results
The researchers evaluated M3D against several strong baselines, including Large Vision-Language Models (LVLMs) like LLaVA-1.5 and MiniGPT-v2.
Performance on M3DC
On their own benchmark, M3D demonstrated superior performance, particularly in distinguishing “Neutral” claims—a notorious weak point for standard LVLMs, which tend to be overconfident.
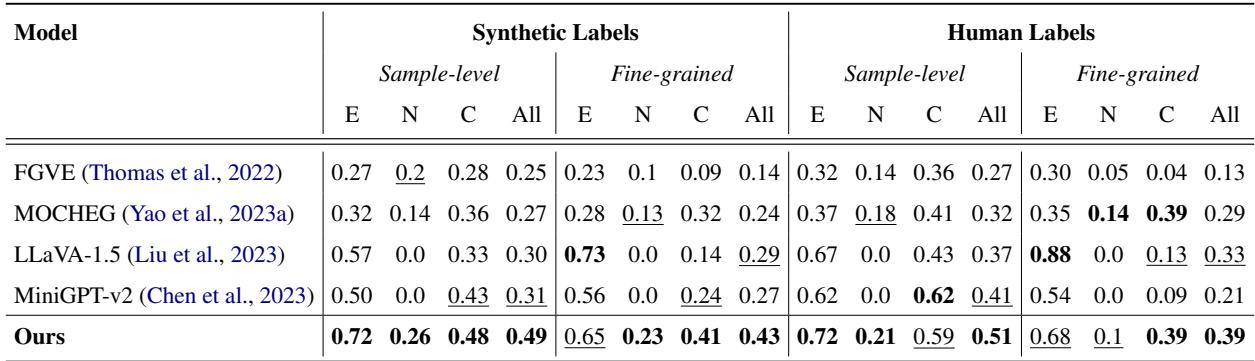
As shown in Table 3, M3D achieves a significantly higher F1 score on Neutral (N) and Contradicted (C) classes compared to the baselines.
Generalization to Other Datasets
To prove their model wasn’t just overfitting their own data, they tested it zero-shot (without retraining) on the MOCHEG dataset.
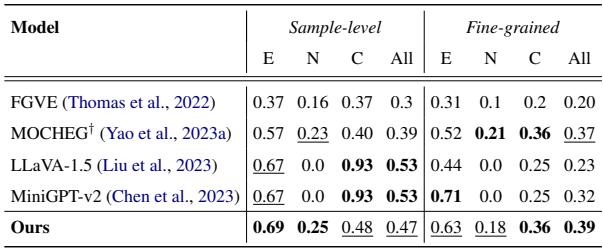
Table 4 shows that M3D outperforms state-of-the-art models like LLaVA-1.5 in fine-grained accuracy. While some LVLMs scored higher on sample-level prediction, they failed to handle neutral cases effectively, often guessing randomly or defaulting to “contradicted” when unsure.
Qualitative Analysis: Seeing the Logic
The power of M3D is best understood visually. In the example below, the model analyzes a claim about a “government building” being attacked.
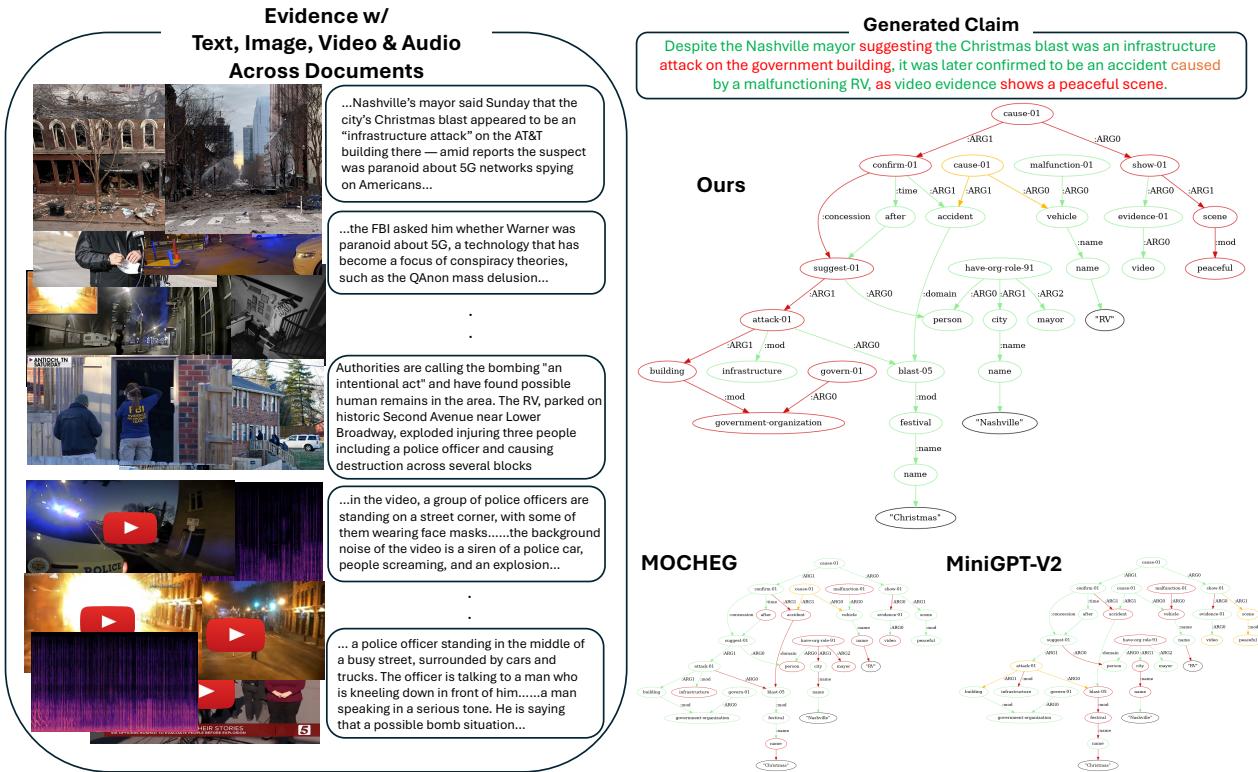
In Figure 5, look at the graph generated by “Ours” (M3D). It correctly identifies that the specific node referring to “government building” is contradicted (Red) because the evidence (text and audio) confirms it was an AT&T building. It also identifies the audio evidence of “police sirens” contradicting the claim of a “peaceful scene.” In contrast, baseline models like MOCHEG or MiniGPT-v2 fail to produce a coherent graph or identify the specific errors.
Here is another example of the fine-grained predictions:
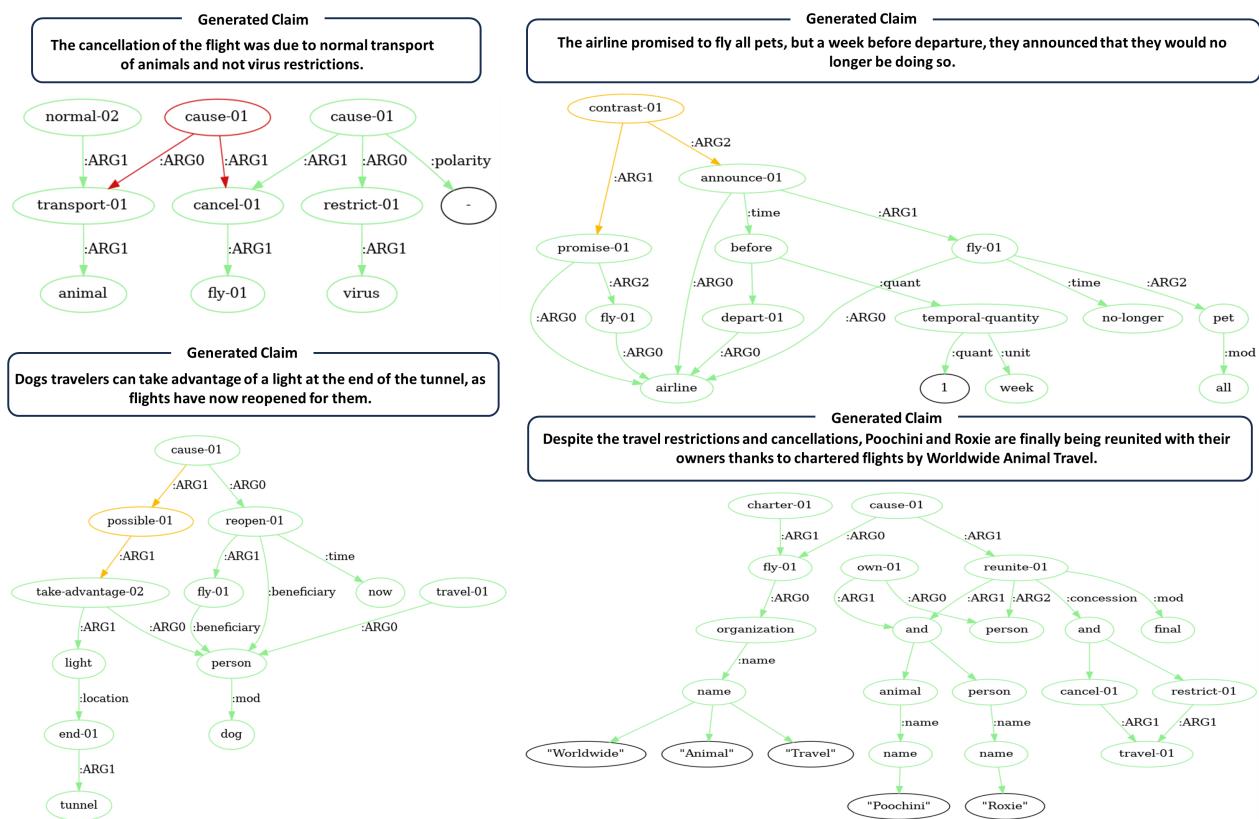
In Figure 8 (top left), the model correctly identifies a contradiction regarding flight cancellations, marking the causal link as False (Red).
Does Multimodality Matter?
The researchers conducted an ablation study to see which data types contributed most to performance.
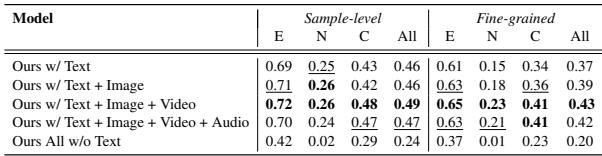
Interestingly, Table 5 shows that removing text causes the biggest drop in performance. This is expected in news verification, where the core narrative is often textual. However, the best performance is achieved when all modalities (Text + Image + Video + Audio) are present, proving that the model successfully integrates cross-modal clues to refine its judgment.
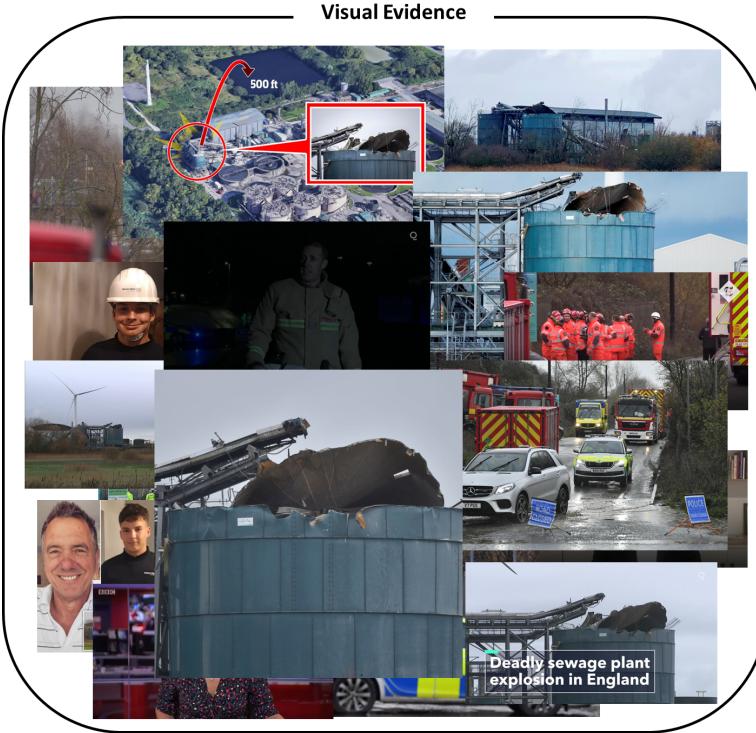
The dataset includes many examples where visual evidence is key. For instance, in Figure 7 below, verifying the extent of damage or the specific equipment involved relies heavily on interpreting the images alongside the reports.
Conclusion
The M3D framework represents a significant step forward in automated fact-checking. By moving away from binary “True/False” flags and towards fine-grained, multimodal analysis, it offers a more transparent and useful tool for verifying information.
Key Takeaways:
- Granularity is Key: Users benefit more from knowing what is wrong than just that something is wrong.
- Multimodality is Essential: Real-world claims span text, video, and audio. Ignoring any modality leads to blind spots.
- Synthesis Matters: The M3DC dataset creation pipeline demonstrates a powerful way to generate high-quality training data for complex reasoning tasks.
As generative AI continues to blur the lines between fact and fiction, systems like M3D that can dissect the logic of a claim against a web of evidence will be crucial for maintaining trust in the digital ecosystem.