](https://deep-paper.org/en/paper/file-3722/images/cover.png)
Introduction
Imagine trying to teach a child to speak, but you are only allowed to point to single, isolated objects against a white background. “Cat.” “Chair.” “Apple.” The child might learn the names of these objects perfectly. But what happens when you show them a cat sleeping on the chair? Or an apple next to the cat?
Language isn’t just about naming things; it is about describing the relationships between things. This is the challenge of compositionality—the ability to combine simple units (like words) into complex meanings (like sentences).
In the field of AI and Language Emergence, researchers train artificial agents to communicate with each other to solve tasks. For years, the standard “referential game” has looked a lot like that restricted child-rearing scenario: agents communicate about single entities. While this has taught us a lot about how communication protocols can emerge from scratch, it lacks the complexity of the real world. Real scenes have multiple entities, and the spatial relationships between them matter.
In this deep dive, we are exploring a fascinating research paper titled “The Emergence of Compositional Languages in Multi-entity Referential Games: from Image to Graph Representations.” The researchers propose a new, more complex game involving multiple entities and explore a fundamental question: Does the way an AI “sees” the world—as raw pixels or as structured graphs—change the kind of language it invents?
Background: The Referential Game and The Problem of Input
Before we dissect the new method, we need to understand the playground these AI agents live in.
The Classic Referential Game
The setup is borrowed from game theory and linguistics (specifically Lewis signaling games). It involves two neural networks:
- The Sender: Sees a target object and sends a message (a sequence of symbols) to the Receiver.
- The Receiver: Reads the message and tries to pick the correct target object from a lineup of “distractors.”
If the Receiver picks the right object, both agents get a reward (or minimize a loss function). Over thousands of rounds, they develop a shared protocol—a language—to describe the objects.
The “Compositionality” Grail
If an agent sees a red circle and says “glorp,” and sees a blue square and says “fip,” it has learned names. But if it sees a red square, we hope it says something like “glorp-fip” (red-square). This is compositionality. It means the language has structure: parts of the message refer systematically to parts of the input.
Previous research has hit a snag:
- Images (Pixels): When agents look at raw images, they struggle to develop compositional languages. The data is “entangled”—a “red square” is just a bunch of colored pixels; the concept of “red” and “square” aren’t separated explicitly.
- Feature Vectors: If you feed the agent a list of features (e.g.,
[color=red, shape=square]), they develop compositional languages easily. However, feature vectors don’t scale. You can’t easily have a fixed-size vector for an image that might contain one cat, or maybe five cats and a dog.
The Solution? Graphs.
The authors of this paper propose Graphs as the “Goldilocks” solution.
- Like feature vectors, graphs are disentangled. A node representing a “cat” is distinct from a node representing “on top of.”
- Like images, graphs scale gracefully. You can represent a complex scene with many entities using Graph Neural Networks (GNNs) without needing to change the fundamental architecture.
Core Method: A Tale of Two Entities
To test their hypothesis, the researchers designed a new “Multi-entity Referential Game.” Instead of describing a single object, the Sender must describe a scene containing two entities placed in a 4-position grid (Top-Left, Top-Right, Bottom-Left, Bottom-Right).
For example, a target might be: An eagle in the top-left and a rabbit in the bottom-right.
The agents must learn to communicate not just what is in the grid (shapes), but where they are relative to each other (spatial relations).
The Architecture of Communication
The communication process is mathematically structured using Recurrent Neural Networks (RNNs).
The Sender takes an input item (\(I_t\)), processes it into a vector representation (\(f_S(I_t)\)), and uses an RNN to generate a sequence of symbols (Message \(M\)).

The Receiver takes that message \(M\), runs it through its own RNN, and compares the result against the embeddings of potential target items (\(I_1...I_n\)). It uses a Softmax function to calculate the probability of each item being the target.
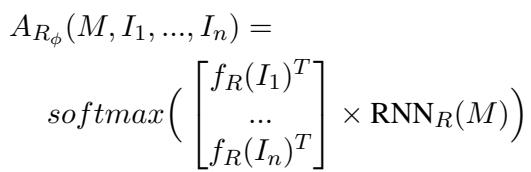
Finally, the agents are trained together using a loss function that penalizes them when the Receiver fails to identify the correct target.
Visualizing the World: From Pixels to Graphs
This is the most critical contribution of the paper. The authors didn’t just test “Graphs vs. Images.” They recognized that there are many ways to build a graph to represent the statement “Eagle top-left, Rabbit bottom-right.”
They proposed four distinct Graph Schemas, plus the baseline Image representation.
Let’s look at the visual breakdown provided in the paper:
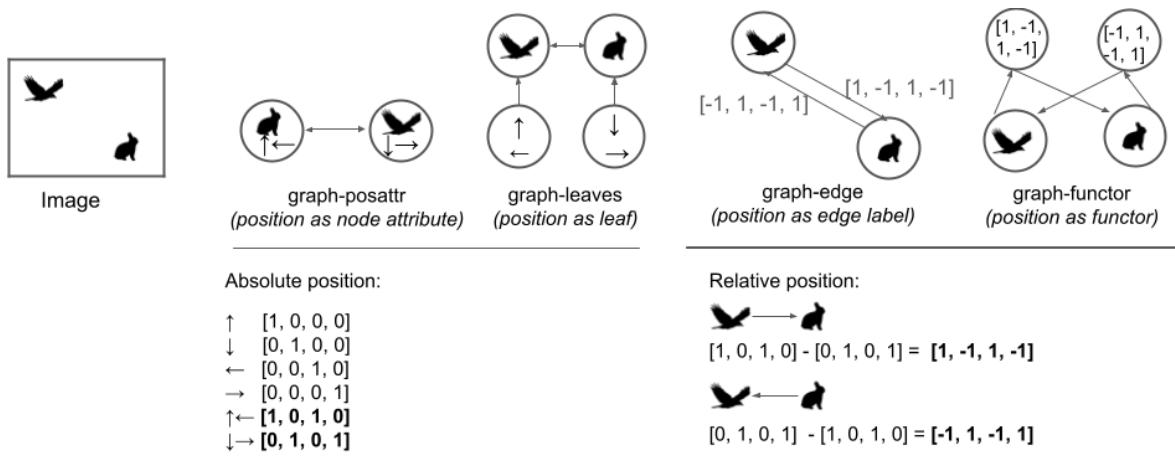
Let’s break down these four graph representations shown in Figure 1:
- Graph-posattr (Position as Attribute):
- Concept: The position is a property of the object itself.
- Structure: Two nodes (Eagle, Rabbit). Each node contains features for “Shape” (Eagle) and “Position” (Top-Left).
- Analogy: Like wearing a name tag that says “Eagle” and a hat that says “Top-Left.”
- Graph-leaves (Position as Leaf Node):
- Concept: Position is a separate entity linked to the object.
- Structure: A central “Eagle” node is connected to a “Top-Left” node.
- Analogy: The Eagle is holding a balloon that says “Top-Left.”
- Graph-edge (Position as Edge Label):
- Concept: Position is defined by the relationship between objects. It uses relative positioning.
- Structure: An edge connects the Eagle to the Rabbit. The label on the edge says “(-1, 1)” (meaning the Rabbit is 1 step down and 1 step right relative to the Eagle).
- Analogy: A map where the Eagle is the starting point and the path to the Rabbit is described by directions.
- Graph-functor (Position as Function):
- Concept: A logical, functional approach.
- Structure: A “Function” node (representing the relative position like “Above-Left”) points to the two entities.
- Analogy: A mathematical function \(f(x, y)\) where \(f\) is the position and \(x, y\) are the animals.
The Image model, largely serving as the baseline, uses a Convolutional Neural Network (CNN) to look at the pixel grid directly.
Experiments & Results
The researchers trained pairs of agents using these five different input representations (Image + 4 Graphs) across different game difficulties. The difficulty was adjusted by changing the number of distractors (Game Size) and the maximum allowed length of the message.
1. Can they understand each other? (Communication Success)
The first hurdle is basic competence. Can the Sender describe the scene well enough for the Receiver to pick it out?
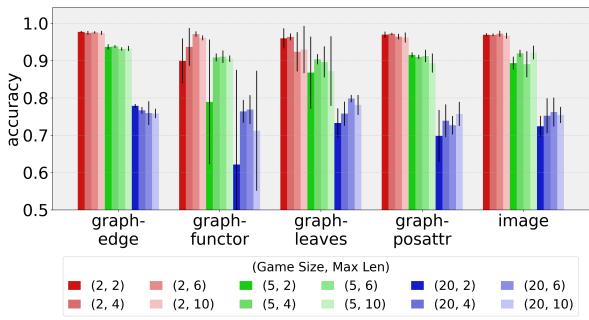
As shown in Figure 2, the answer is a resounding yes.
- The Y-axis represents accuracy (1.0 = 100%).
- Even in the hardest games (Game Size 20, meaning 1 target and 19 distractors), accuracy often stays above 70%.
- Surprise Winner: The
graph-edgeandimagerepresentations generally performed the best. - The Takeaway: Both pixel-based and graph-based agents are capable of solving complex multi-entity tasks.
2. Do they speak a structured language? (Compositionality)
This is where the analysis gets deep. To measure if the language is “human-like” (compositional), the authors use a metric called Topographic Similarity (topsim).
- How
topsimworks: It compares distances in the “Meaning Space” to distances in the “Message Space.” - Example: If “Eagle-Left” and “Eagle-Right” are similar scenes (distance is small), their messages should also be similar (e.g., “glorp-fip” and “glorp-bop”). If the messages were totally different (“glorp” vs “zazzle”), the
topsimscore would be low.
The researchers compared the emergent languages against a “perfectly compositional” script (e.g., a script that effectively says “Eagle Top-Left Rabbit Bottom-Right”).
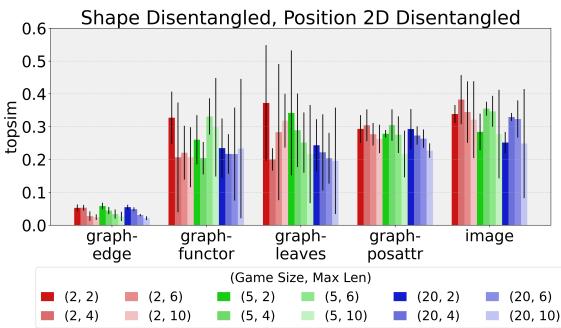
Figure 3 reveals something unexpected.
- Most models achieve a moderate score (around 0.2 - 0.3). This suggests some structure, but it’s not perfect.
- The Outlier: The
graph-edgemodel (the blue bars on the far left) has significantly lower compositionality scores in many configurations compared to the others.
Wait, didn’t graph-edge have high accuracy? Yes. This implies that graph-edge agents are solving the task effectively, but using a language that doesn’t map cleanly to the human-style “Object + Position” description.
3. The Detective Work: What are they actually saying?
To understand why the compositionality scores were moderate, the authors performed “ablation studies” on the meaning space. They calculated topsim again, but this time they manipulated the “ground truth” to see what the agents were focusing on.
They tested two scenarios:
- Shape Only: Does the language track with the identities of the animals (Eagle vs Rabbit) regardless of position?
- Position Only: Does the language track with the locations (Top-Left vs Bottom-Right) regardless of the animals?
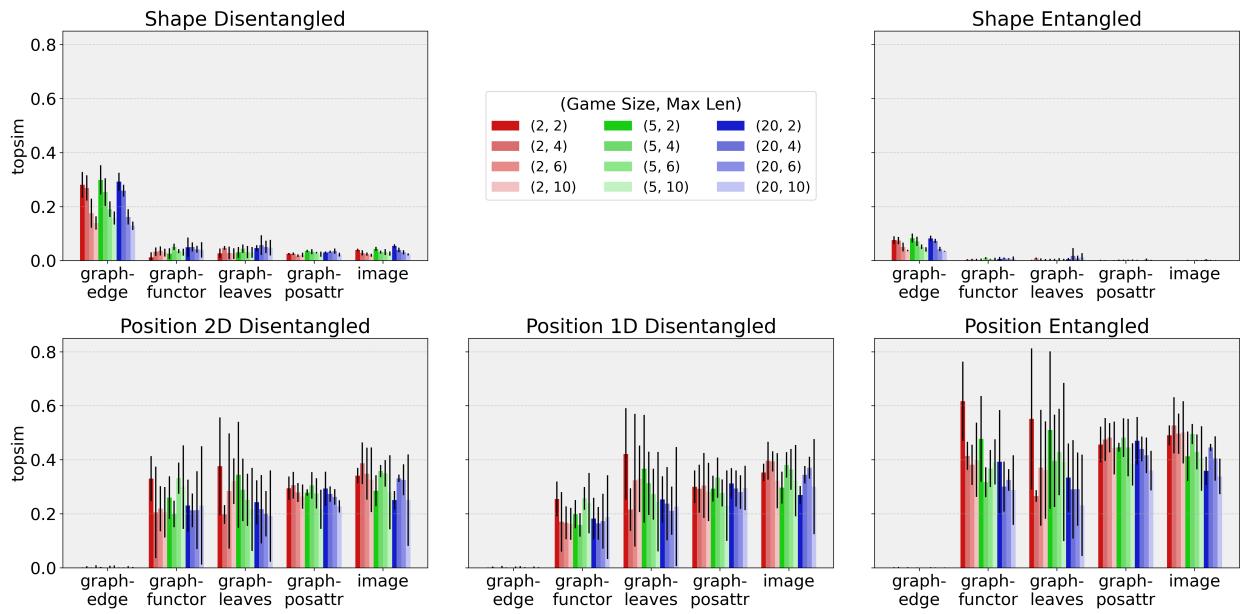
Figure 4 is the “smoking gun” of the paper. Look at the difference between the columns.
Column 1 (Shape Disentangled): Look at the top-left graph. The
graph-edgemodel (far left bars) scores very high here.Interpretation: Agents using
graph-edgeare very good at naming shapes. They have distinct words for “Eagle” and “Rabbit.”Column 1 (Position 2D Disentangled): Look at the bottom-left graph. The
graph-edgemodel scores near zero.Interpretation:
graph-edgeagents essentially ignore independent positional descriptions.The Inverse for Images & Other Graphs:
The
image,graph-posattr,graph-leaves, andgraph-functormodels show the opposite trend. They have low scores for pure Shape, but higher scores for Position.This suggests these agents might be prioritizing where things are over what they are, or perhaps “entangling” the shape into the position.
The “Entanglement” Hypothesis
The authors dug even deeper (Column 3 of Figure 4). They checked if the agents were treating the two positions as a single concept (e.g., a specific word for “Top-Left AND Bottom-Right” together) rather than two separate coordinates.
The data suggests that for position, agents indeed favor entanglement. They tend to describe the configuration of the grid as a whole, rather than describing the position of each entity individually. This explains why they solve the task (they recognize the grid layout) but fail standard compositionality tests (which expect “Top-Left” and “Bottom-Right” to be separate words).
4. Evolution of Language
Finally, how does this develop over time? Do they start with shapes and learn positions later?
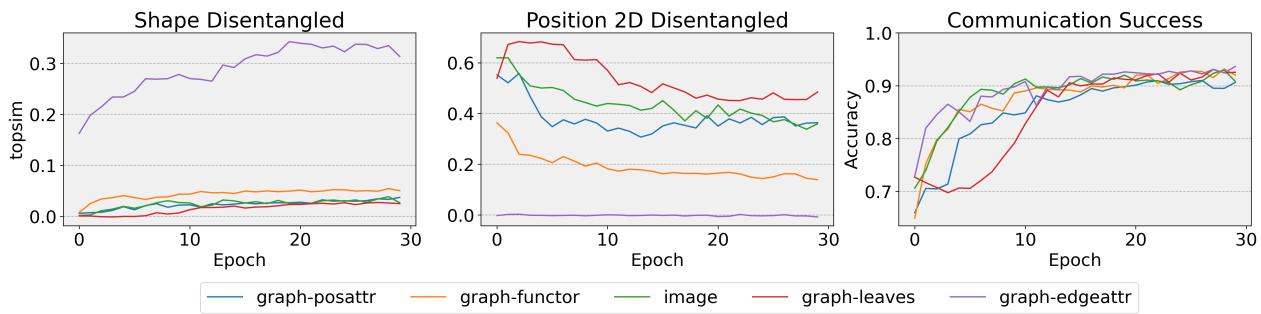
Figure 5 shows the training progression over 30 epochs.
- Accuracy (Bottom Graph): Shoots up quickly for all models. They learn to play the game fast.
- Compositionality (Top Graphs):
- The purple line (
graph-edge) in the top graph shows a steady increase in Shape compositionality. It slowly learns to separate the objects. - The red line (
graph-leaves) in the middle graph starts with high Position compositionality but actually decreases slightly. It seems that as the agent gets better at the game, it might be sacrificing clear positional language for specialized “shortcuts.”
Conclusion & Implications
This paper takes a significant step toward more realistic AI communication. By moving from single objects to multi-entity scenes, the researchers exposed the complex trade-offs agents make between naming things and naming relations.
Key Takeaways:
- Multi-Entity Games are Solvable: AI agents can successfully communicate about complex spatial relationships, whether they look at pixels or graphs.
- No “Perfect” Input:
- Graph-edge representations pushed agents to be very good at naming objects (Shapes) but bad at describing locations systematically.
- Images and other graph types pushed agents to focus on the spatial layout (Position), often treating the whole grid configuration as a single concept rather than compositional parts.
- The “Syntax” Gap: A fully human-like language requires a mechanism to link specific entities to specific positions (e.g., “The Eagle is at the Top-Left”). While the agents developed basic vocabulary, they struggled to develop this level of syntactic “glue,” often resorting to entangling concepts to maximize efficiency.
This research highlights that how we represent data to an AI fundamentally shapes the language it develops. If we want AI to communicate with us naturally about the world, we likely need inputs that balance the disentanglement of features (like graphs) with the holistic context of the environment (like images). The future of AI language emergence likely lies in combining these views—giving agents both the “eyes” to see the scene and the “conceptual structure” to understand it.