In the late 2000s, the internet was overflowing with images. Flickr had billions of photos, Google was indexing countless more, and social media was just beginning its visual explosion. For computer vision researchers, this digital flood was both a tantalizing opportunity and a monumental challenge. On one hand, more data meant the potential to train more powerful and robust models. On the other, this data was a chaotic, unlabeled mess. How could you possibly teach a computer to recognize a Siberian husky when your training data was a jumble of random images tagged “dog”?
This was the core problem that a team of researchers from Princeton University set out to solve. Their answer, presented in the 2009 paper “ImageNet: A Large-Scale Hierarchical Image Database”, was not just another dataset—it was a paradigm shift. An ambitious project to create a massive, meticulously organized, and cleanly labeled database that mapped out the entire world of objects. ImageNet didn’t just provide images; it embedded them within a rich semantic hierarchy borrowed from linguistics. This monumental effort would go on to fuel the deep learning revolution and change the course of artificial intelligence forever.
In this article, we’ll dive deep into this seminal paper: exploring what made ImageNet so special, how its creators wrangled millions of internet images into a high-quality resource, and how they demonstrated its ability to push the boundaries of computer vision.
What Made ImageNet So Special?
Before ImageNet, computer vision datasets were relatively small. Datasets like Caltech101 or PASCAL VOC, while foundational, contained thousands of images across a few dozen to a hundred categories. They were instrumental for research but couldn’t capture the scale and diversity of the visual world. ImageNet adopted a radically different philosophy, built around four core properties: scale, hierarchy, accuracy, and diversity.
1. Unprecedented Scale
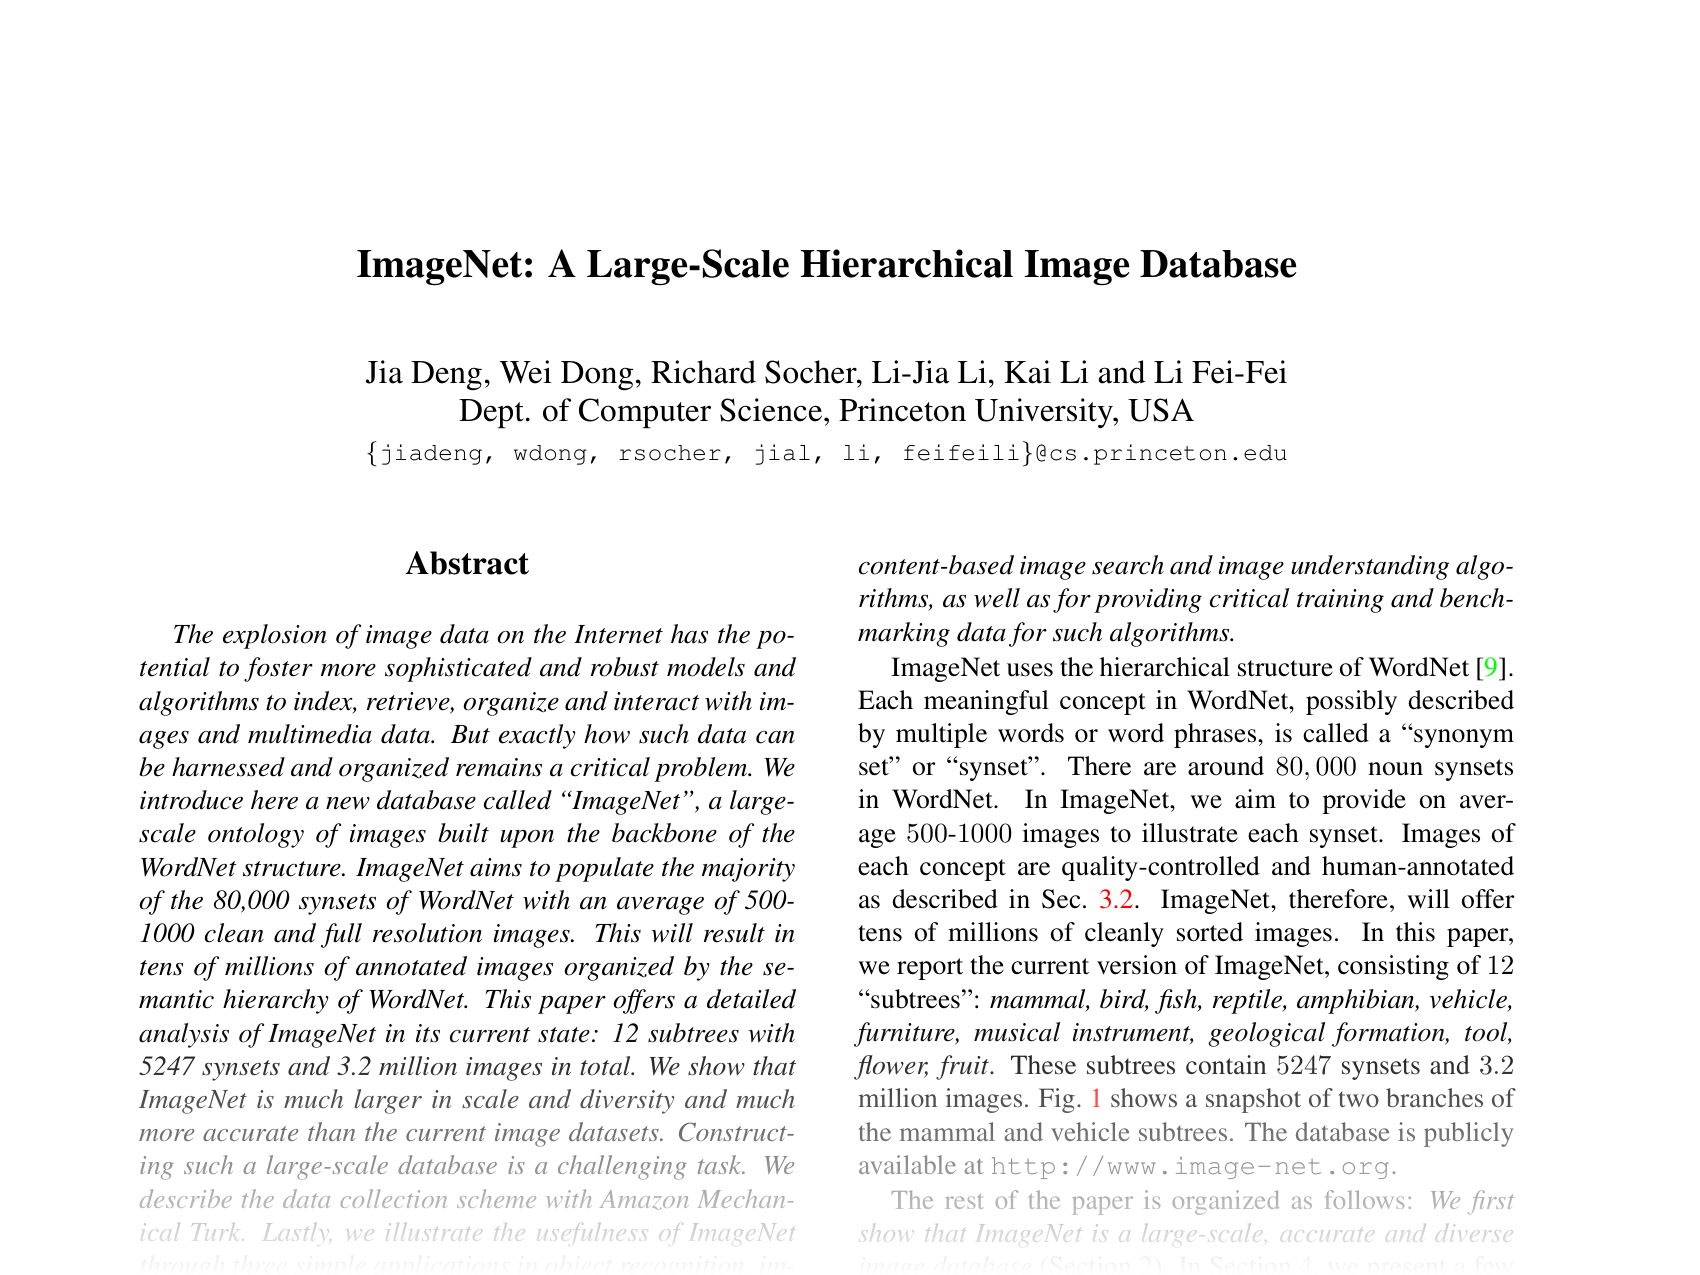
ImageNet’s primary goal was to be enormous. While other datasets had hundreds of images per category, ImageNet aimed for 500–1000 clean, high-resolution images for each of the tens of thousands of concepts in its structure. At the time of the paper’s publication, the project had already amassed 3.2 million images across 5,247 categories.

As shown above, many synsets contained well over 600 images. This sheer scale wasn’t just for bragging rights—it was fundamental for training models that could generalize to the messy, unpredictable conditions of the real world, moving far beyond the clean, constrained examples in smaller datasets.
2. A Rich Semantic Hierarchy
Perhaps ImageNet’s most brilliant innovation was its structure. Instead of a flat list of categories like “car,” “dog,” and “chair,” the dataset was organized using the backbone of WordNet—a large lexical database of English in which nouns, verbs, and adjectives are grouped into sets of cognitive synonyms called synsets.
Each synset represents a distinct concept (e.g., the “dog” synset includes terms like “dog,” “canis familiaris”), and synsets are linked by semantic relations, the most important being IS-A relationships. For example:
“Husky” is a “working dog” → is a “dog” → is a “canine” → is a “carnivore” → is a “placental” → is a “mammal.”
ImageNet populated these synsets with images, creating a vast, browsable tree of visual concepts.

This hierarchical structure was revolutionary—it allowed models to understand relationships between concepts. A model that failed to identify a “trimaran” might still classify it correctly as a “sailboat” or a broader “watercraft.” This is a far more nuanced, human-like way of understanding the visual world than a simple flat label.
The authors illustrated how dense ImageNet’s hierarchy was compared to others—the ESP dataset, for example, had far fewer subcategories.

3. High Accuracy
Collecting millions of images from the internet is one thing; ensuring those images are correctly labeled is another. Image search results are notoriously noisy—a query for “jaguar” might return the animal, the car, or even the software.
To guarantee quality, the ImageNet team aimed for near-perfect precision: for example, every image in the “Burmese cat” synset had to actually depict a Burmese cat. This was verified by having independent human judges cross-check samples at multiple hierarchy levels. The result? 99.7% average precision across the dataset.

This remarkable accuracy meant that researchers could train models without worrying about mislabeled “garbage” corrupting their results.
4. Rich Diversity
The team wanted ImageNet to reflect real-world conditions: objects photographed from varied angles, in different lighting, partially occluded, and with cluttered backgrounds.
To quantify diversity, they devised a clever heuristic: if you average all images in a diverse category, the result should be blurry and unstructured; uniform categories produce sharp averages. Blurriness compresses better, meaning a smaller lossless JPG file size. By comparing average image file sizes, they showed ImageNet categories were consistently more diverse than those in datasets like Caltech101.

ImageNet vs. The World
When compared to other datasets, ImageNet stood apart. The table below summarizes the differences:

ImageNet eliminated label ambiguity (solving the “bank” problem—river bank or financial institution?), provided full-resolution imagery, and offered unmatched hierarchical depth. ESP’s data, for instance, was mostly at the “basic” cognitive level (“bird”), while ImageNet had a balanced spread from broad superclasses (“mammal”) to fine-grained subclasses (“star-nosed mole”).

How Was ImageNet Built? Crowdsourcing and Quality Control
A dataset of this magnitude required a novel collection method. Graduate students manually collecting and labeling images was not feasible—this would have taken decades. The team developed a two-stage pipeline leveraging internet-scale retrieval and crowdsourcing.
Step 1: Collecting Candidate Images
For each synset, the researchers used its keywords as queries to major image search engines. They expanded these queries by:
- Adding words from parent synsets (e.g., “whippet dog”).
- Translating queries into other languages (Chinese, Spanish, Dutch, Italian) using multilingual WordNets.
This produced huge pools—over 10,000 candidate images per synset on average—but with only ~10% estimated accuracy.
Step 2: Cleaning with Amazon Mechanical Turk
To separate signal from noise, they turned to Amazon Mechanical Turk (AMT), a global crowdsourcing platform for micro-tasks. AMT workers saw candidate images and synset definitions, and answered: “Does this image contain an object of this category?”
However, ambiguity for fine-grained categories made consensus difficult.

The team implemented a sophisticated quality control algorithm:
- Multiple Annotators: Each image was labeled by multiple workers; it was accepted only with a convincing majority.
- Dynamic Consensus: Required consensus varied by category difficulty—easy (“cat”) needed fewer votes, hard (“Burmese cat”) needed more.
- Confidence-Based Verification: Initial samples (≥10 workers per image) were used to build confidence tables mapping vote patterns to correctness probability. Remaining images were labeled until a threshold was reached—automatically tailoring redundancy to synset difficulty.
This approach balanced efficiency with rigor, enabling both scale and accuracy.
Putting ImageNet to the Test: Three Applications
To prove ImageNet’s value, the authors showcased three research applications.
1. Non-Parametric Object Recognition
They tested whether larger, cleaner, higher-resolution data improved object recognition, using nearest-neighbor classification on Caltech256 test images.
Four setups were compared:
- NN-voting + Noisy ImageNet: Raw candidate images, downsampled to 32×32 px.
- NN-voting + Clean ImageNet: Human-verified images.
- NBNN: Naive-Bayes Nearest Neighbor using SIFT features from full-resolution images.
- NBNN-100: NBNN, limited to 100 images per category.

Findings:
- Clean Data Helps: Clean ImageNet beat noisy candidate sets.
- Resolution Helps: Full-resolution + rich features (NBNN) outperformed low-resolution pixel comparisons.
- Scale Helps: More images improved NBNN performance beyond the 100-image limit.
2. Tree-Based Image Classification
Leveraging hierarchy, the tree-max classifier computed a synset’s score as the max of its own classifier and all its children’s scores.

The tree-max consistently outperformed independent classifiers, showing hierarchy-aware methods can improve accuracy without extra training. Leaf nodes were easier to classify than high-level concepts, likely due to greater visual coherence.
3. Automatic Object Localization
Extending ImageNet with object bounding boxes makes it invaluable for detection training and benchmarks. Using a non-parametric graphical model, they produced bounding boxes for objects in 22 categories.

Recall was high (objects usually found), but precision varied, reflecting diversity and background clutter.

By clustering bounding boxes via k-means, they revealed distinct subtypes/viewpoints within single categories—e.g., “tusker” clusters corresponded to side, front, and profile views.

The Legacy of ImageNet
The 2009 paper was just the beginning. The team envisioned covering all ~80,000 WordNet synsets and adding annotations like bounding boxes and segmentation.
History shows they succeeded—and more. In 2010, the ImageNet Large Scale Visual Recognition Challenge (ILSVRC) began. In 2012, AlexNet debuted, smashing records and igniting the deep learning era. Without ImageNet’s massive scale, clean labels, and diversity, these breakthroughs could have taken many more years.
ImageNet remains a testament to the idea that sometimes, the most transformative contribution is not a new algorithm, but a new resource that enables a thousand algorithms to flourish. By meticulously organizing the visual world, its creators gave computers the foundation to truly see it for the first time.